
INTRODUCTION
Maximum paleo-temperatures are strictly linked to rocks rheology and geochemical processes that occur at depth in different geodynamic settings, from passive margins to subduction systems. Thus, correct assessment of maximum paleo-temperatures experienced by rocks is an essential tool to unravel the evolution of the thermal structure of the crust during the main phases of an orogenesis. Classical metamorphic zones, based on metamorphic reactions and pseudosections, suffer from the superimposition of retrograde processes or by the presence/absence of diagnostic minerals that can undermine the accurate determination of the peak temperatures. On the other hand, maximum temperatures derived from the analyses of carbonaceous material (CM) dispersed in rocks have proven to provide robust and, sometimes, more precise data given the irreversible nature of organic matter transformation with temperature increase (Teichmüller, 1986; Taylor et al., 1998; Beyssac et al., 2002; Lahfid et al., 2010). The most used thermal indicators for dispersed organic matter derive from optical analyses (e.g., vitrinite reflectance, color alteration indexes; Hartkopf-Fröder et al., 2015; Spina et al., 2018; Sorci et al., 2020), although, in the last decades, an increasing interest raised towards the use of thermal parameters derived from Raman spectroscopy. This tool was initially developed for metamorphic temperature higher than about 300°C (Pasteris & Wopenka, 1991; Beyssac et al., 2002), but its use has recently been extended to lower metamorphic degrees (Rahl et al., 2005; Lahfid et al., 2010) and diagenesis (Li, 2007; Guedes et al., 2010; Wilkins et al., 2014; Lünsdorf et al., 2017; Schito et al., 2017, 2019; Schmidt et al., 2017; Henry et al., 2018, 2019; Schito & Corrado, 2018). Given the application in a wide range of temperature conditions, Raman spectroscopy on carbonaceous material (RSCM) has become one of the most used geothermometers in geological studies to accurately unravel thermal metamorphic gradients (Negrò et al., 2006; Delchini et al., 2016; Ducoux et al., 2019; Lahfid et al., 2019).
The selected playground for new Raman studies on metamorphic rocks is the Internal Rif in Northern Morocco. This area represents the innermost tectonic domain preserved onshore of the wider Betic-Rif-Tell orogenic chain that developed during the Mesozoic-Cenozoic complex convergence between Africa and Eurasia plates forming the westernmost termination of the Mediterranean Alpine orogenic system (Leprêtre et al., 2018; Royden & Faccenna, 2018).
The Internal Rif offers a unique opportunity to observe at surface high-grade metamorphic rocks from an alpine fossil subduction zone (Sebtide tectonic units) tectonically lying below low-grade metamorphic rocks derived from a complex polyphase Variscan history (Ghomaride tectonic units). In detail, the Ghomarides and Sebtides represent respectively the upper and lower plates preserved in a metamorphic core complex (Chalouan et al., 2008). They are composed by Paleozoic rocks with a partially preserved Mesozoic-Cenozoic cover and by lower Paleozoic to Triassic deep-crustal mica-schists, migmatites and granulites associated with peridotites (Beni Bousera complex), respectively (Chalouan et al., 2008).
Given its importance in the Alpine orogenic reconstruction in the western Mediterranean, the Sebtides have been the subject of several studies aiming at the definition of their P-T deformation history, in particular of their deepest units (Marrone et al., 2021; Soto et al., 1999; Michard et al., 2006; Booth-Rea et al., 2007; Rossetti et al., 2010, 2020; Platt et al., 2013; Gueydan et al., 2015; Melchiorre et al., 2017; Williams & Platt, 2018). On the other hand, the Variscan metamorphic evolution of the Ghomarides complex has been widely studied by Chalouan (1986) and Chalouan & Michard (1990) with the aim to correlate it with the history of similar Variscan terranes in Spain (Betic Cordillera), northern Algeria (Kabylian domain) and southern Italy (Calabro-Peloritain arc).
An accurate study of the maximum paleo-temperatures achieved by Sebtides and Ghomarides in the Internal Rif by means of Raman spectroscopic analyses on carbonaceous material has been already developed by NEGRÒ et al. (2006). Nevertheless, using the RCSM method proposed by Beyssac et al. (2002), the authors did not investigate in detail paleo-temperature distributions in tectonic units that suffered peak metamorphisms lower than 330°C. This led the authors to provide interesting interpretation on the Alpine history of the units surrounding the Beni-Bousera and Ronda peridotites but failed to provide useful constraints for the low-metamorphic Variscan history of the Ghomarides.
The present work aims to fulfill this gap providing more accurate Raman paleo-temperature data, in particular for the Ghomaride succession and for the organic carbon-poor successions of the Upper Sebtides in northern part of the Rif belt.
GEOLOGICAL SETTING
Located at the western edge of the West-Mediterranean Alpine systems, the Rif belt corresponds to the southern limb of Gibraltar Arc that developed in the framework of Africa-Eurasia collision (Docherty & Banda, 1995; Pérouse et al., 2010; Platt et al., 2013; Van Hinsbergen et al., 2014) and is a part of the Maghrebides orogenic system (Tell-Rif; Durand-Delga, 1980). The Maghrebides resulted from the closure of the Maghrebian Tethys and the docking of the Meso-Mediterranean blocks (i.e., Alboran and Kabily domains) onto the African margin during the Early Miocene (Chalouan & Michard, 2004; Leprêtre et al., 2018).
The Rif belt is classically divided into three main tectonostratigraphic domains (Favre & Stampfli, 1992; Frizon De Lamotte et al., 2011), namely from north to south and from internal to external portion of the chain: (i) Internal or Alboran Domain (Milliard, 1959; Bouillin, 1986; García-Dueñas et al., 1992), (ii) Maghrebian Flysch Basin Domain (Guerrera et al., 1993, 2005; Lepretre et al., 2018; Atouabat et al., 2020), and (iii) External Domain (Didon et al., 1973; Leblanc, 1979; Michard et al., 2014; Gimeno-Vives et al., 2019; Gimeno-Vives et al., 2020). The internal domain, object of this work, is subdivided into three tectonic complexes, recognized from bottom to top as: Sebtides complex, Ghomarides complex and the ‘Dorsale Calcaire’ (El Kadiri et al., 1992).
The Sebtide Complex represents the structurally deepest unit and it is composed by the Lower Sebtides (Filalì and Beni Bousera Units) and Upper Sebtides (Federico Unit). The Beni Bousera consists of a peridotite body, with topmost discontinuous slivers of granulites (kinzigites, Chalouan et al., 2008) that emplaced in the crust as a consequence of the Variscan orogen collapse (Rossetti et al., 2020) and was finally exhumed during Alpine stages (Azdimousa et al., 2014). It is separated by the overlying gneisses of the Filalì Unit through a ductile shear zone (Michard et al., 2006; Chalouan et al., 2008; Rossetti et al., 2010). The Federico Unit in the northern part of the Rif is formed by four thrust imbrications, namely Tzigarine, Boquete de Anjera, Beni Mezala 1 and 2 (from here onward BM1 and BM2 respectively), each of them showing the same stratigraphy and a general downward increase in metamorphic grade. The uppermost Tizgarine Unit is composed by Permian-Triassic red pelites, and Middle-Upper Triassic dolomitic marbles. The Permian-Triassic successions of Boquete de Anjera, BM1 and BM2 Units are characterized by purple phyllites and dark quartz-phyllite respectively, overlain by Triassic marbles on top (Bouybaouene et al., 1998). Locally in both Beni Mezala Units, some Carboniferous-Permian schists occur.
Lower and upper Sebtides are thought to have experienced metamorphic conditions that reached the eclogite facies in the Federico Unit under HP-LT conditions and granulite facies under a higher geothermal gradient in Filalì and Beni-Bousera Units (Chalouan & Michard, 1990; Rossetti et al., 2020), even if recent works (Rodríguez-Ruiz et al., 2020) suggested lower metamorphic conditions for the inner BM1 Unit in the northern sector of the study area. Federico Unit is characterized by pervasive planar and linear tectonic fabric with a top-to-the NNW sense of shearing (Michard et al., 2006).
The Ghomaride complex consists of an Ordovician to Carboniferous succession, uncomformably overlain by Triassic red beds and, locally, Liassic limestones and Paleocene-Eocene calcarenites (Calvo et al., 2001). This complex includes four Paleozoic tectonic units that, from the bottom to the top, are the Akaili Unit, the Koudiat Tizian Unit and the Beni Hozmar Unit. A fourth unit, Talembote Unit, is a klippe preserved above the Dorsale Calcaire in the Oued-Laou area (Chalouan & Michard, 1990; Chalouan et al., 2008). In the different units the Ordovician to Silurian stratigraphy is rather homogeneous, characterized by Ordovician phyllites with quartzites and meta-conglomerates and by graptolitic shales and pillow basalts at the top of the Silurian section. Devonian sediments consist of distal calcareous flysch in the Akaili Unit and more proximal flysch and pelagic limestones in the Koudiat-Tizian and Beni-Hozmar (Chalouan, 1986). The Ordovician to Devonian succession was subjected to Eo-Variscan metamorphic event deformation characterized by NNE trending structures and white mica, chlorite and quartz recrystallization (Chalouan & Michard, 1990). Visean-Bashkirian greywackes uncomformably onlap, showing NW oriented structures and limited recrystallization associated with a late Variscan low grade metamorphic event. Brittle Alpine deformation was recorded in the unconformable Triassic red beds that mostly constitute the uppermost deposits except for some Jurassic limestones and Upper Eocene conglomerates that locally crop out (Zaghloul et al., 2010).
Finally, the ‘Dorsale Calcaire’, consists of Triassic-Middle Jurassic carbonate platform deposits, Jurassic-Cretaceous sediments overlayed by Paleocene-Eocene clays and limestones and by Eocene to Aquitanian clastic deposits and olistostromes (El Kadiri et al., 1992). It is detached along the Triassic levels, from most likely the Ghomarides (Durand-Delga & Olivier, 1988) or partly from Ghomarides and Sebtides (Wildi, 1983). The Triassic successions are composed by dolostones, dolomitic breccias and stromatolitic dolostones, while during the Jurassic, a transition to a more distal environment is represented by a condensed pelagic sedimentation in the entire succession. Eocene deposits composed of arenites, bioclastic limestones and chaotic breccias, are separated by an unconformity from the Mesozoic succession, indicative of an uplift in early Eocene times (Michard & Chalouan, 1990; Chalouan et al., 2008).
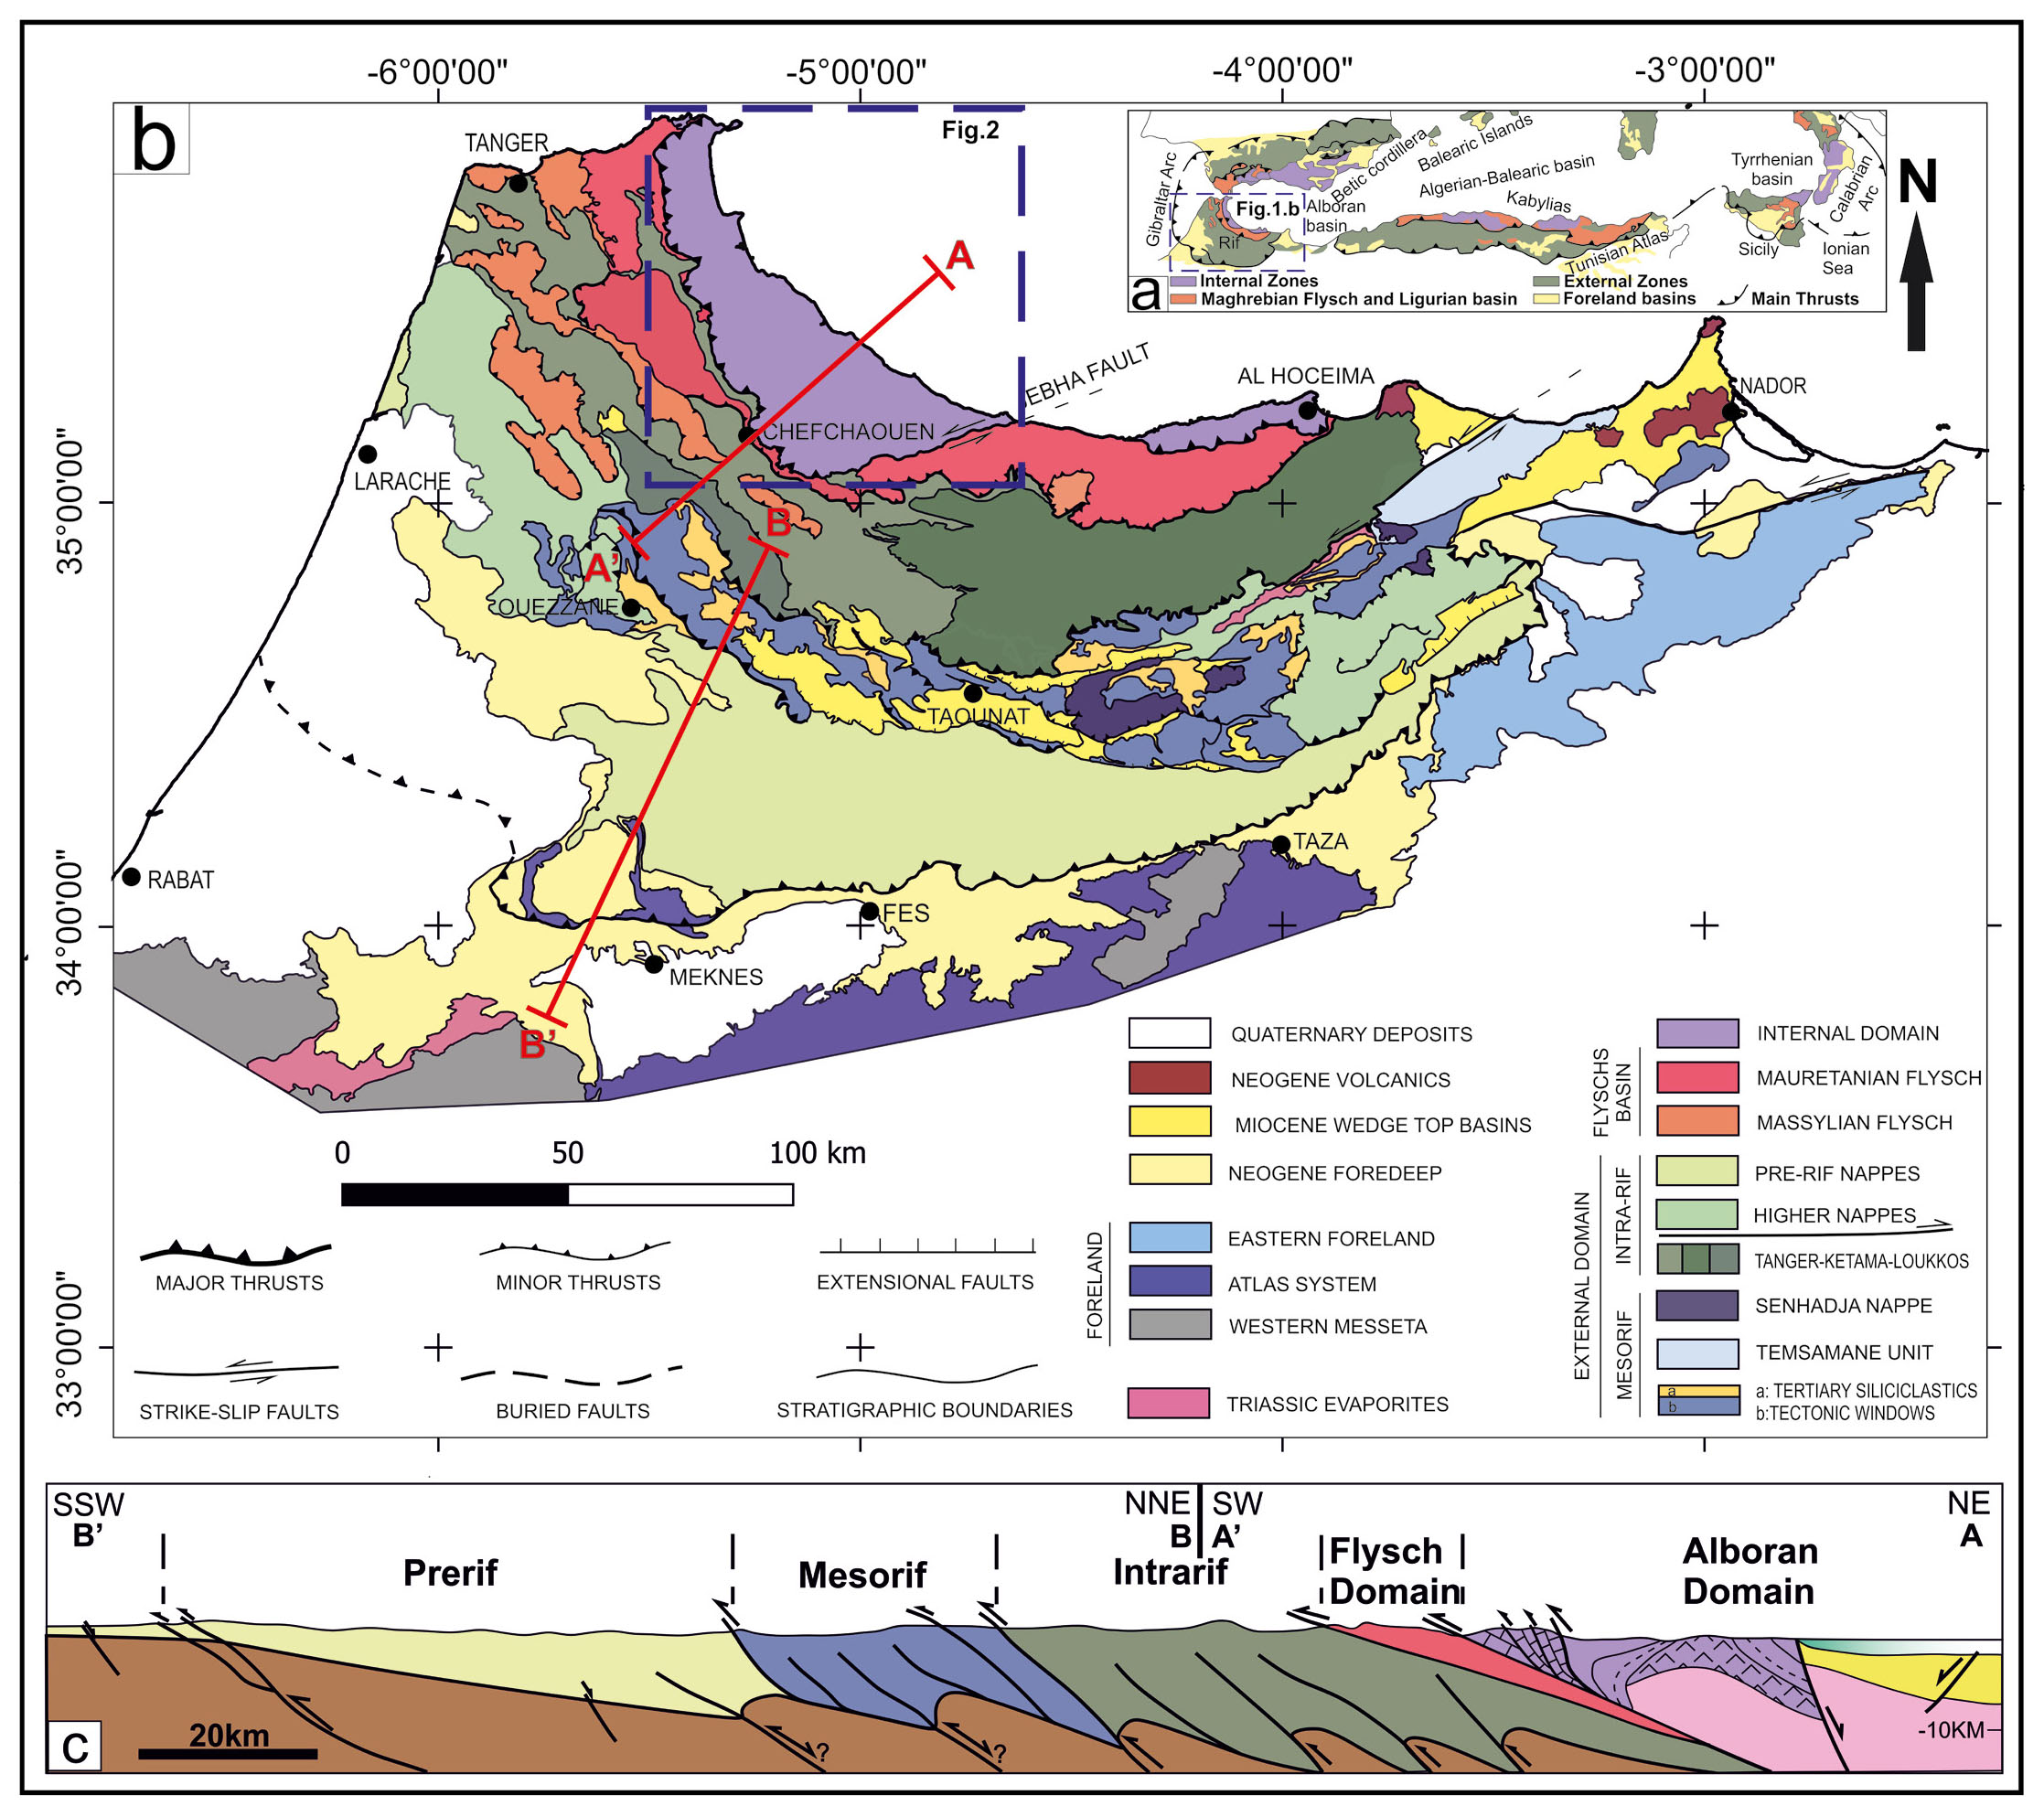
- Schematic geological map of the South Mediterranean (a) and of the Rif chain in North Morocco (b). Schematic cross section from the Alboran Sea to the external zones (c) (modified after; Suter, 1980; Frizon De Lamotte et al., 2017; Gimeno-Vives et al., 2019; Atouabat et al., 2020).
SAMPLING AREAS AND MATERIALS
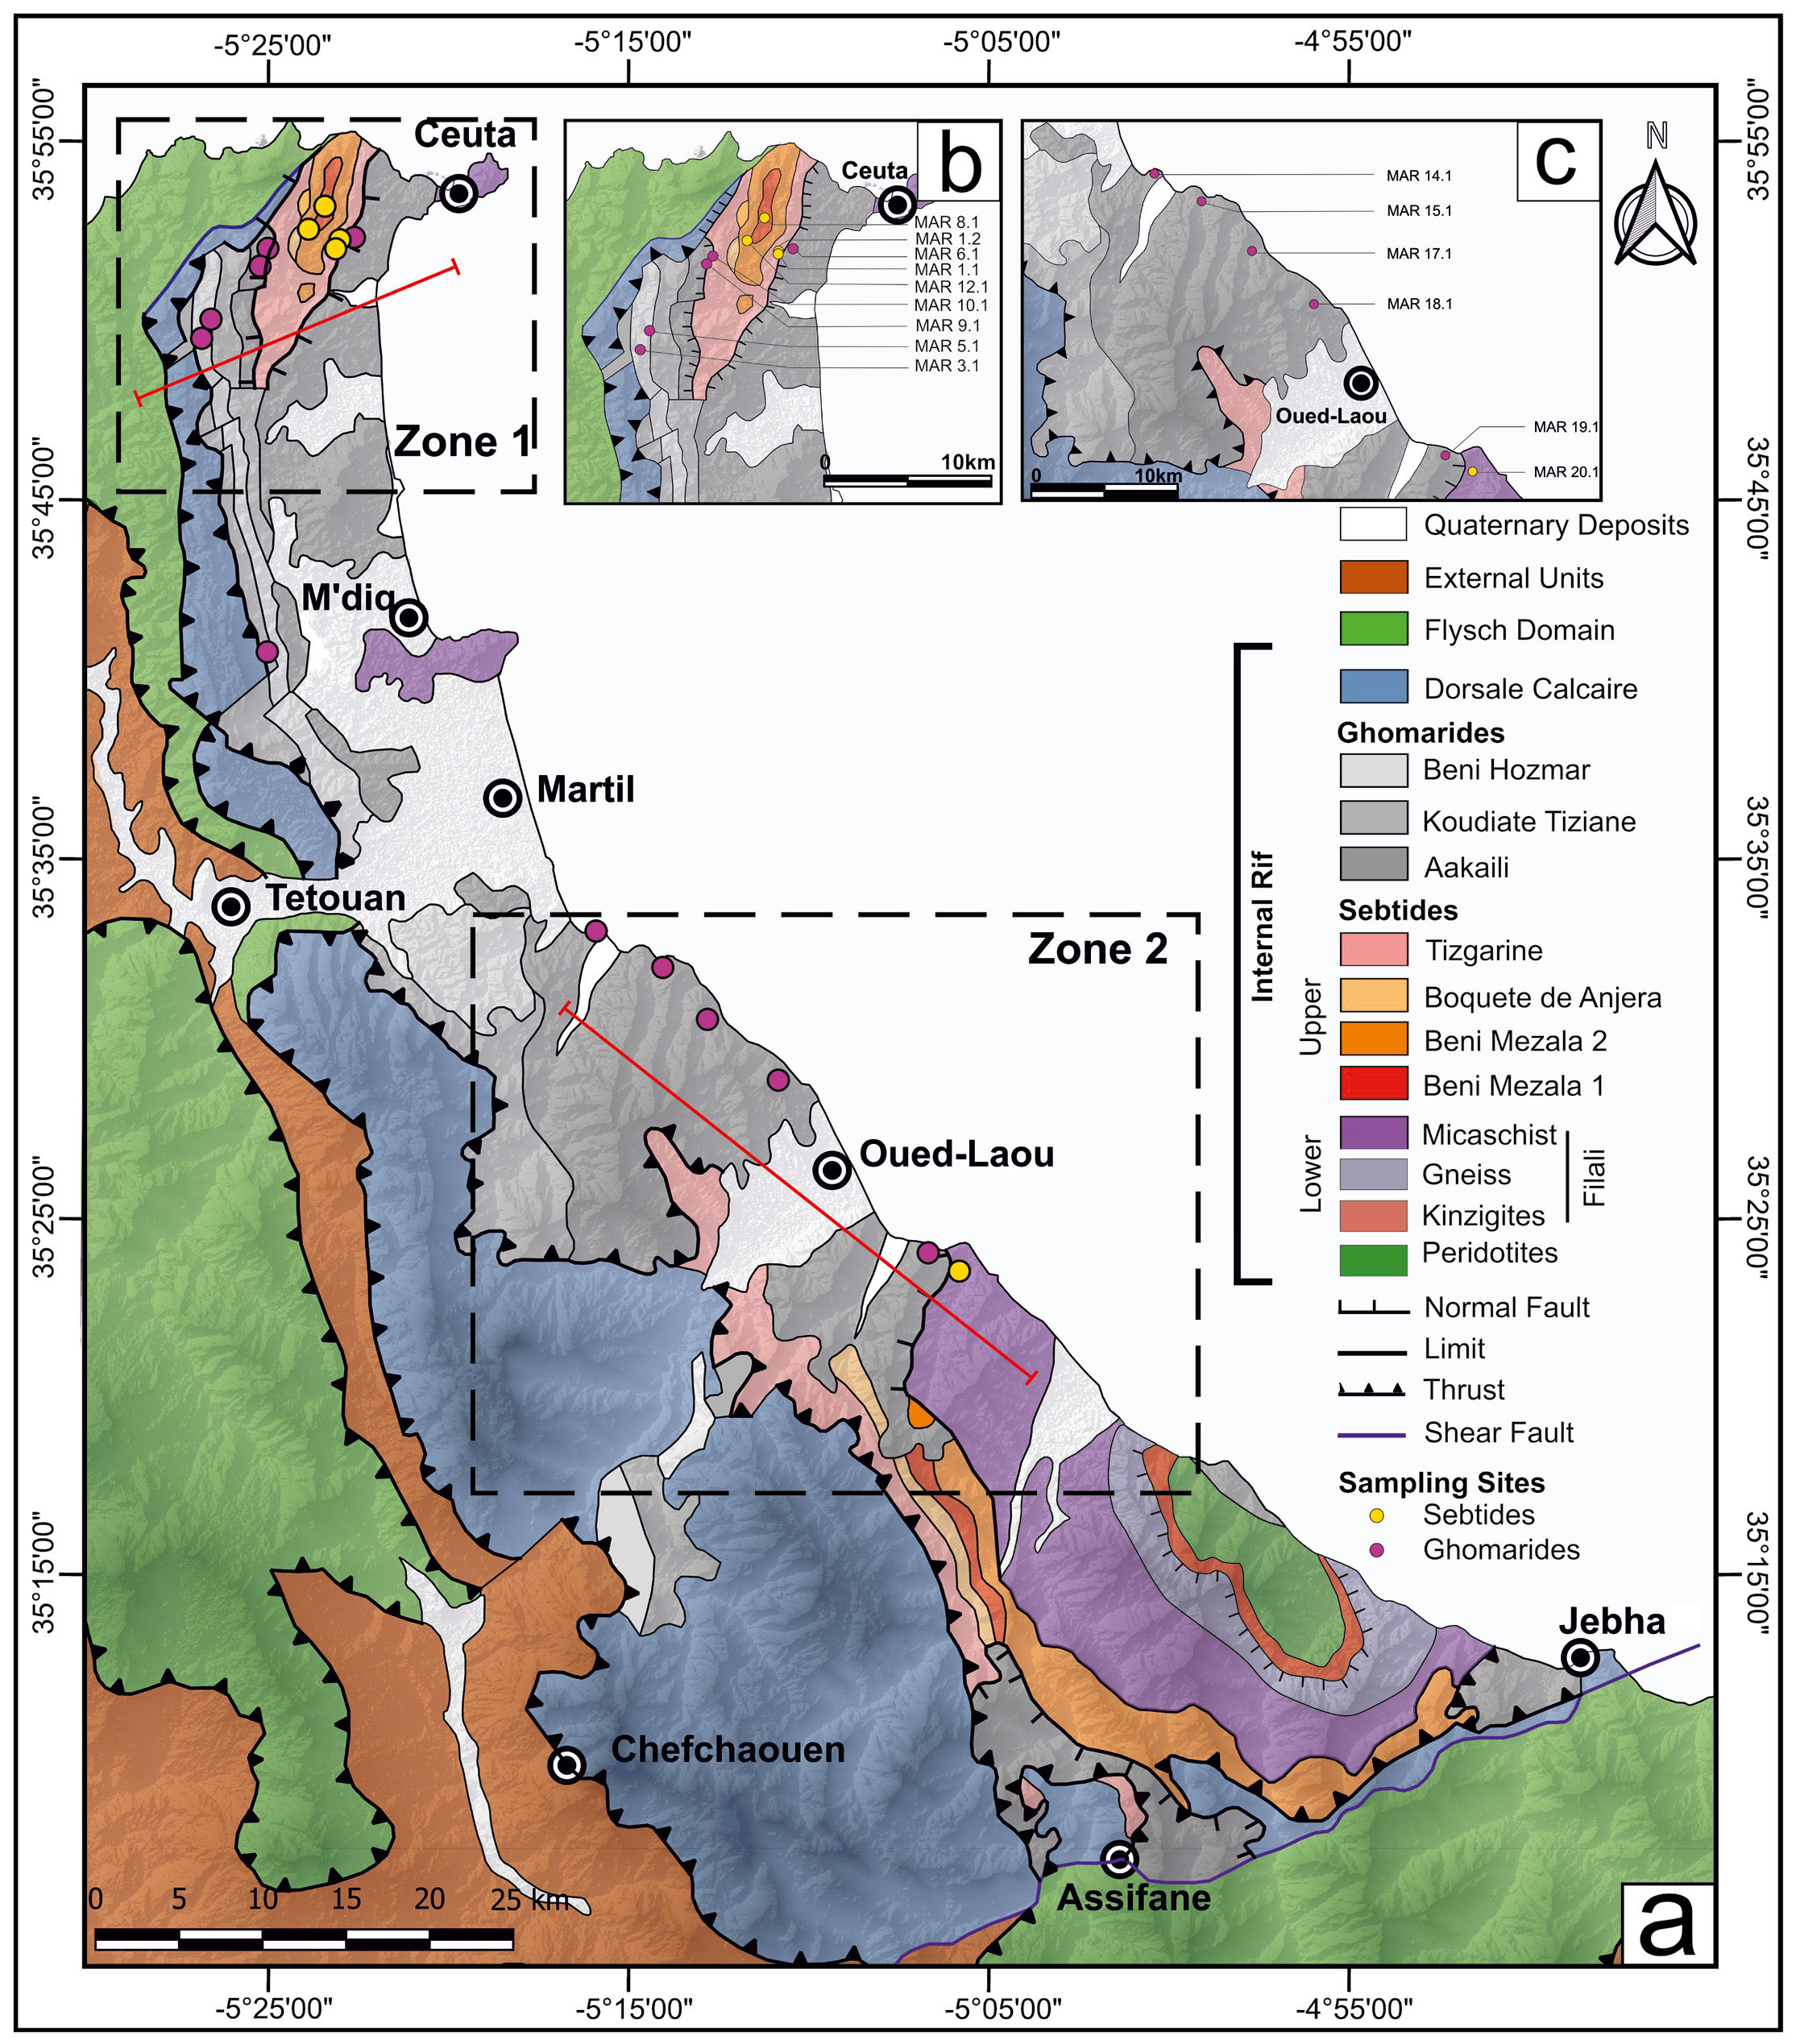
Sixteen samples from the Internal Rif have been collected and analysed from two areas (Fig. 2a): the Beni Mezala antiform to the North (Zone 1) and the region between Martil Village and Oued Laou, to the south of the town of Tetouan (Zone 2).
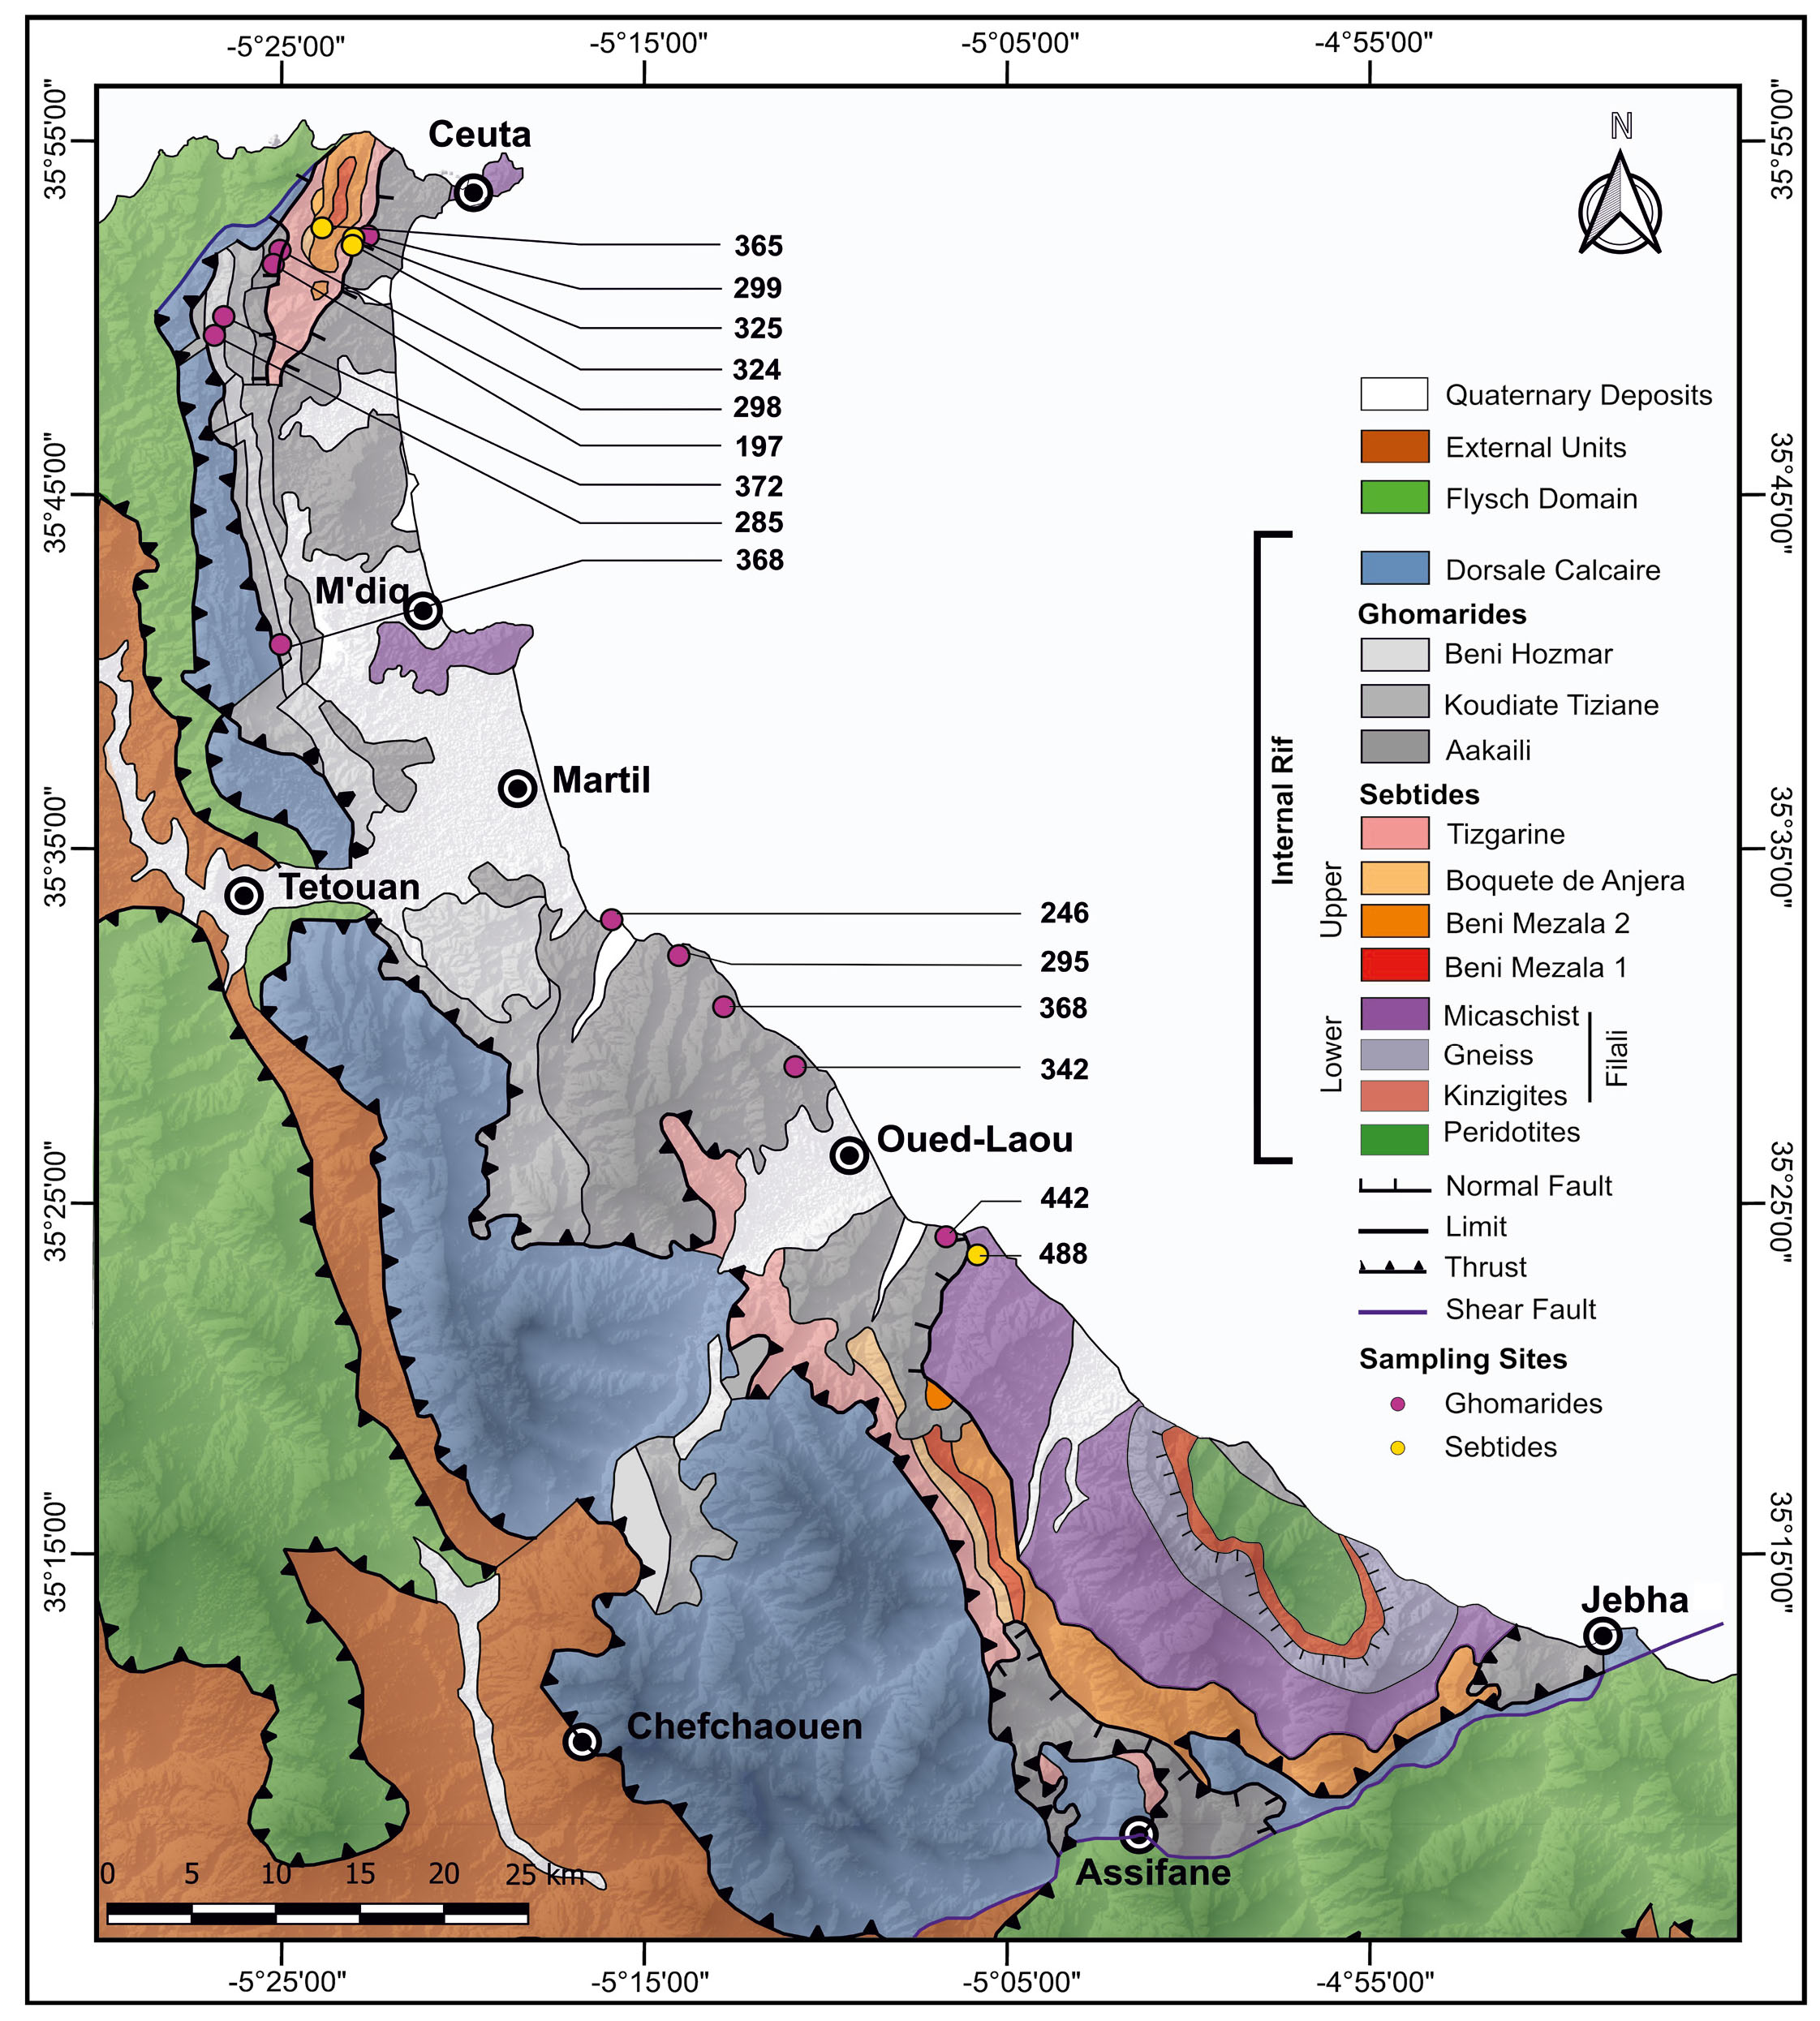
- A. Geological map of Internal Rif with indicated sampling zones (1 and 2) and sampling sites. Redrawn after Chalouan et al., 2008.
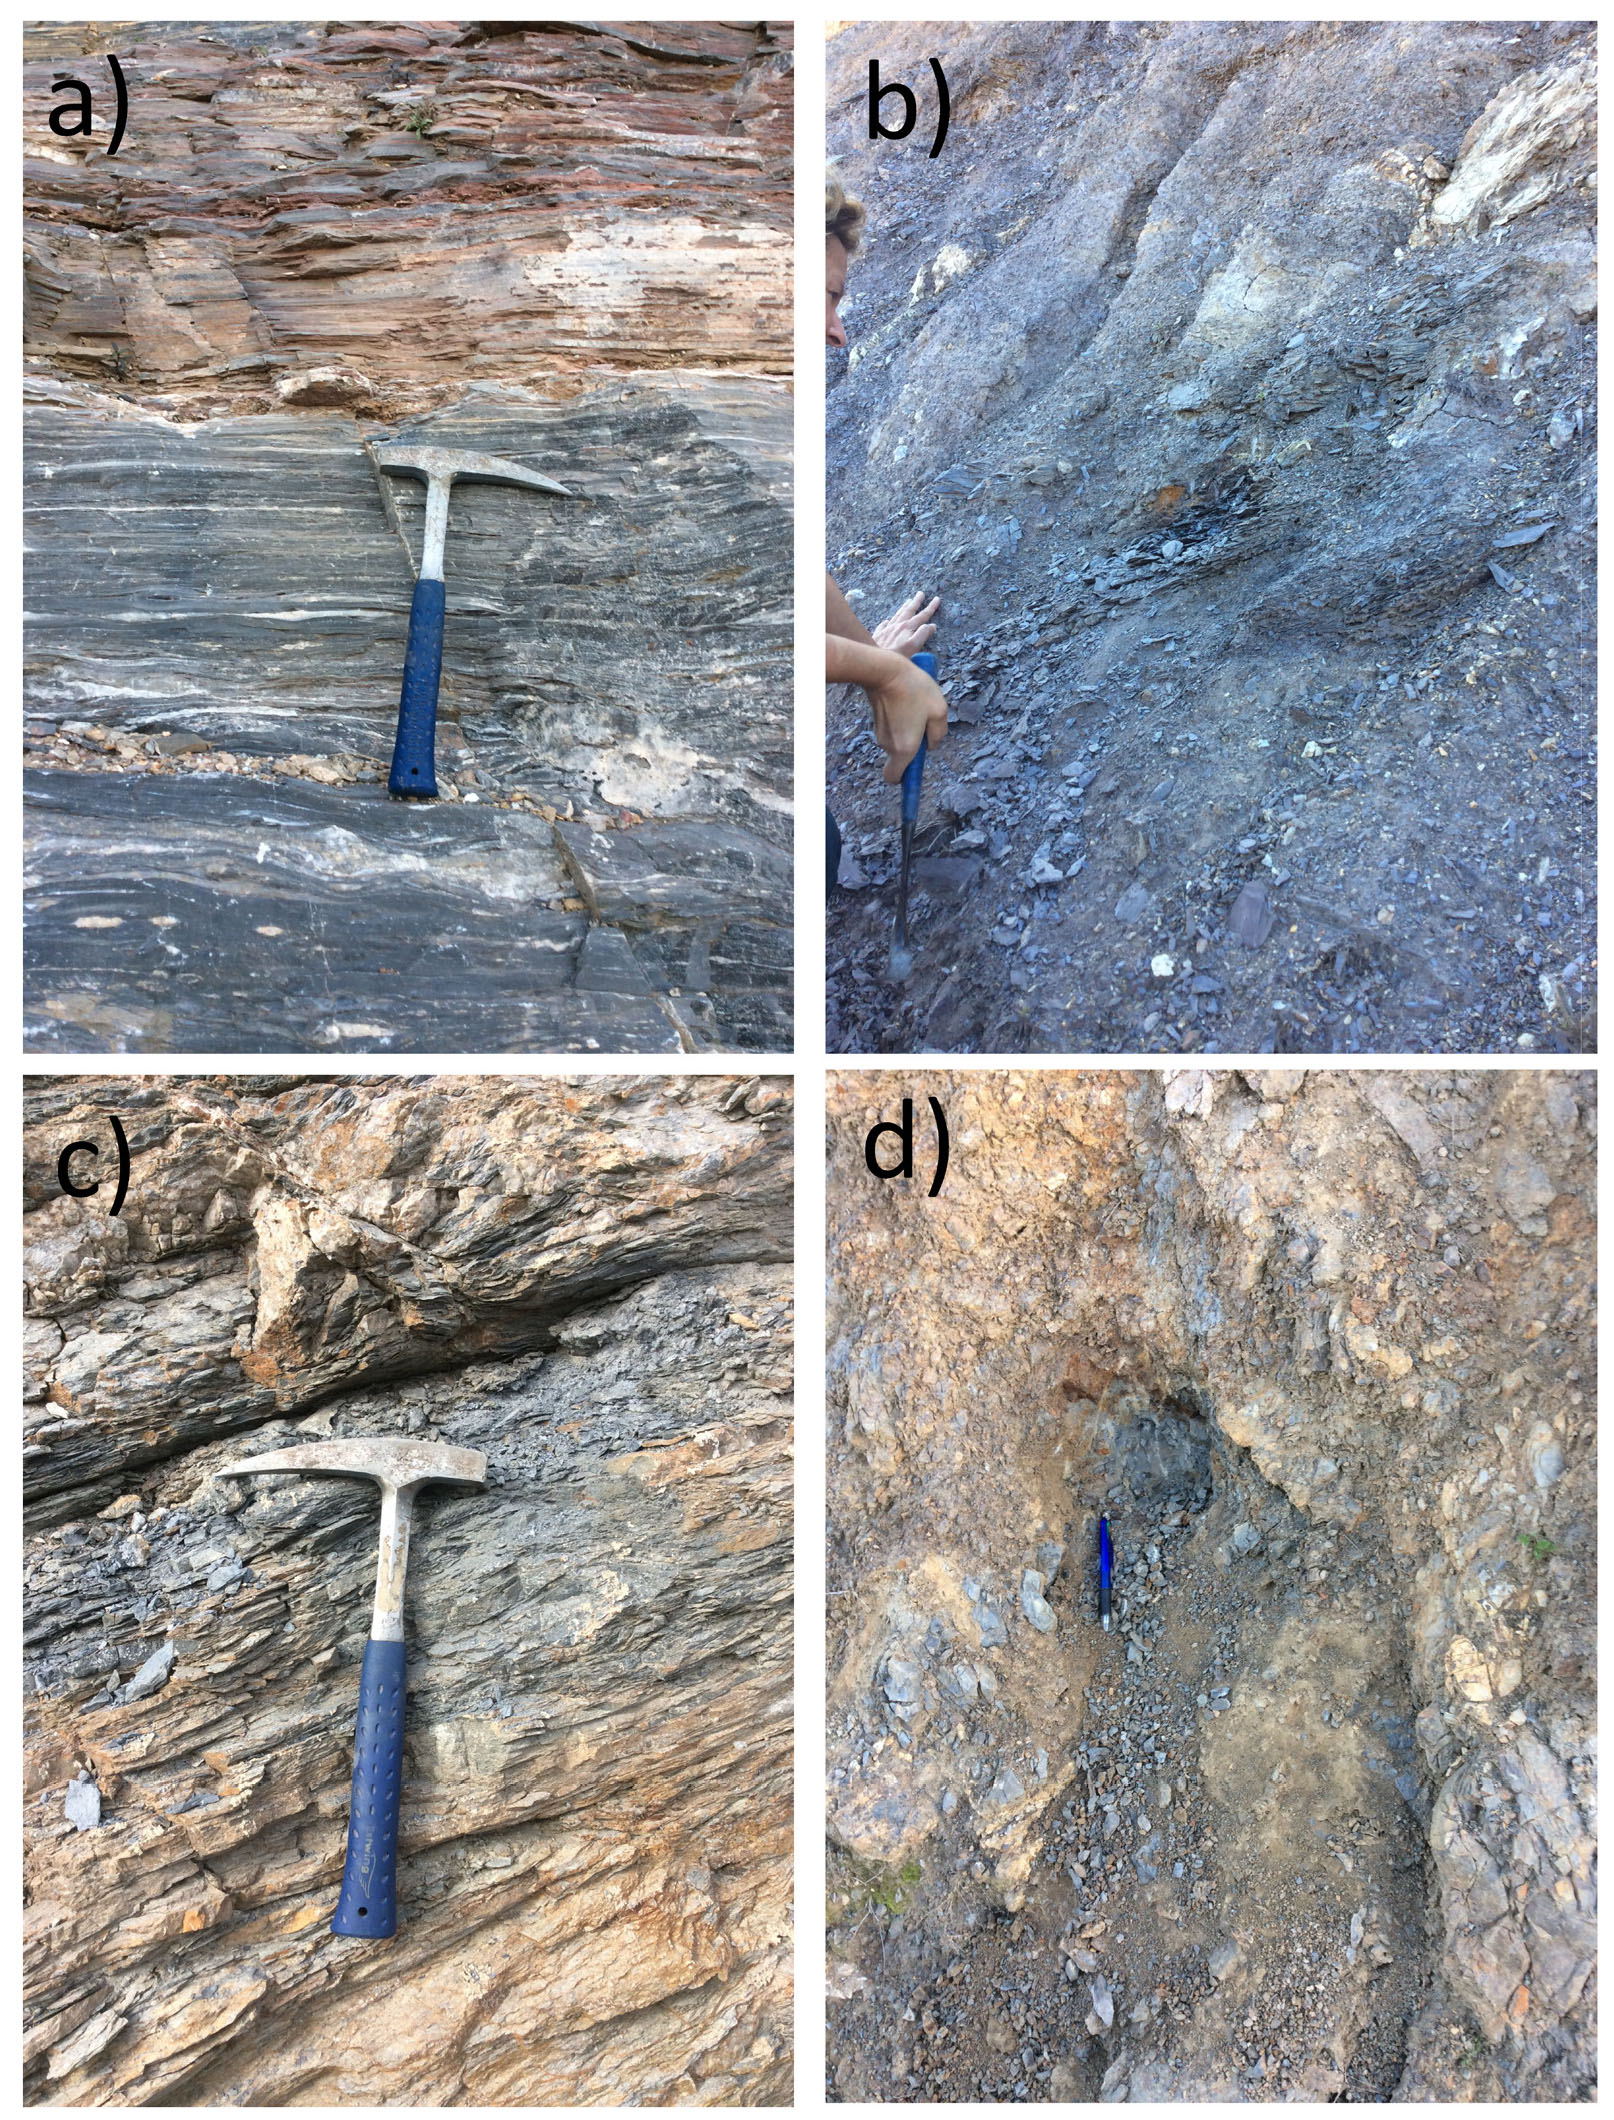
- Outcrop examples of a) schists from BM 2 Unit; b) black phyllites from Tizgarine Unit; c) Devonian pelites from the Ghomarides; d) Carboniferous pelites from the Ghomarides.
In Zone 1, sampling was performed along a NE-SW transect from the South of Ceuta town to the contact between the ‘Dorsale Calcaire’ and the Flysch domain (Fig. 2b) across the Beni Mezala antiform. Five samples were collected in the Federico Units (Figs. 2b and 3a, b) in the core of the antiform and five from Ghomarides on both flanks of it (Figs. 2b and 3c, d). Samples from Ghomarides derived from Silurian and Carboniferous sections of the Akaili and Beni-Hozmar Units (Table 1). One sample (Mar 4.1) comes from a Silurian shaly horizon in the Beni-Hozmar Unit further to the South, close to the contact with the ‘Dorsale Calcaire’ (Fig. 2a).
| Complex | Sample name | Long. | Lat. | Tectonic Unit | Age |
|---|---|---|---|---|---|
| GHOMARIDES | MAR_5.1 | 05° 26’ 51” | 35° 49’ 56” | Beni Hozmar | Silurian |
| MAR_4.1 | 05° 26’ 57″ | 34° 49’ 40″ | Beni Hozmar | Silurian | |
| MAR_3.1 | 05° 27’ 10” | 35° 49’ 24” | Beni Hozmar | Carboniferous | |
| MAR_19.1 | 05° 02’ 20” | 35° 23’ 59” | Akaili | Silurian | |
| MAR_18.1 | 05° 07’ 27” | 35° 28’ 47” | Akaili | Silurian-Devonian? | |
| MAR_17.1 | 05° 09’ 52” | 35° 30’ 29” | Akaili | Devonian | |
| MAR_15.1 | 05° 12’ 24” | 35° 32’ 02” | Akaili | Devonian | |
| MAR_14.1 | 05° 13’ 41” | 35° 32’ 56” | Akaili | Carboniferous | |
| MAR_10.1 | 05° 24’ 57” | 35° 51’ 48” | Akaili | Silurian | |
| MAR_9.1 | 05° 24’ 57” | 35° 51’ 48” | Akaili | Carboniferous | |
| MAR_6.1 | 05° 21’ 57″ | 35° 52’ 12″ | Akaili | Silurian | |
| SEBTIDES | MAR_1.2 | 05° 22’ 27” | 35° 52’ 8” | Tizgarine | Permian |
| MAR_1.1 | 05° 22’ 26” | 35° 52’ 8” | Tizgarine | Permian | |
| MAR_12.1 | 05° 23’ 31” | 35° 52’ 26” | Beni Mezala 2 | Permian-Triassic | |
| MAR_8.1 | 05° 22’ 50″ | 35° 52’ 56″ | Beni Mezala 1 | Permian-Triassic | |
| MAR_20.1 | 05° 01’ 16″ | 35° 23’ 28″ | Filalì | Ordovician-Devonian |
In Zone 2, samples were collected across a NW-SE oriented transect from Amsa village to Oued-Laou river (Fig. 2a and c) covering an area where mainly Ghomarides Akaili and Sebtides Filalì Units crop out. In the Ghomarides, one sample comes from Carboniferous pelitic levels of the Akaili Unit cropping out in Ras Mazari cape area (close to the North of Amsa village), whereas all the others derive from Devonian to Ordovician Ghomarides (Akaili Unit). In this sector of the Septides, sample Mar 20.1 comes from Filalì Unit (Tab. 1).
METHODS
TOC (total organic carbon) expresses the percentage of organic carbon weight related to the total weight of the analyzed rock. In this work data were acquired using a TOC Elementar model TOC VARIO Select analyzer, coupled with an oven (max temperature of 850°C).
Raman spectroscopic analyses allowed to determine the degree of order of the organic matter and thus paleo-temperatures experienced by the rocks during prograde metamorphism (e.g., Raman spectroscopy on carbonaceous material geothermometer – RSCM; Beyssac et al., 2002; Lahfid et al., 2010; Lünsdorf et al., 2014).
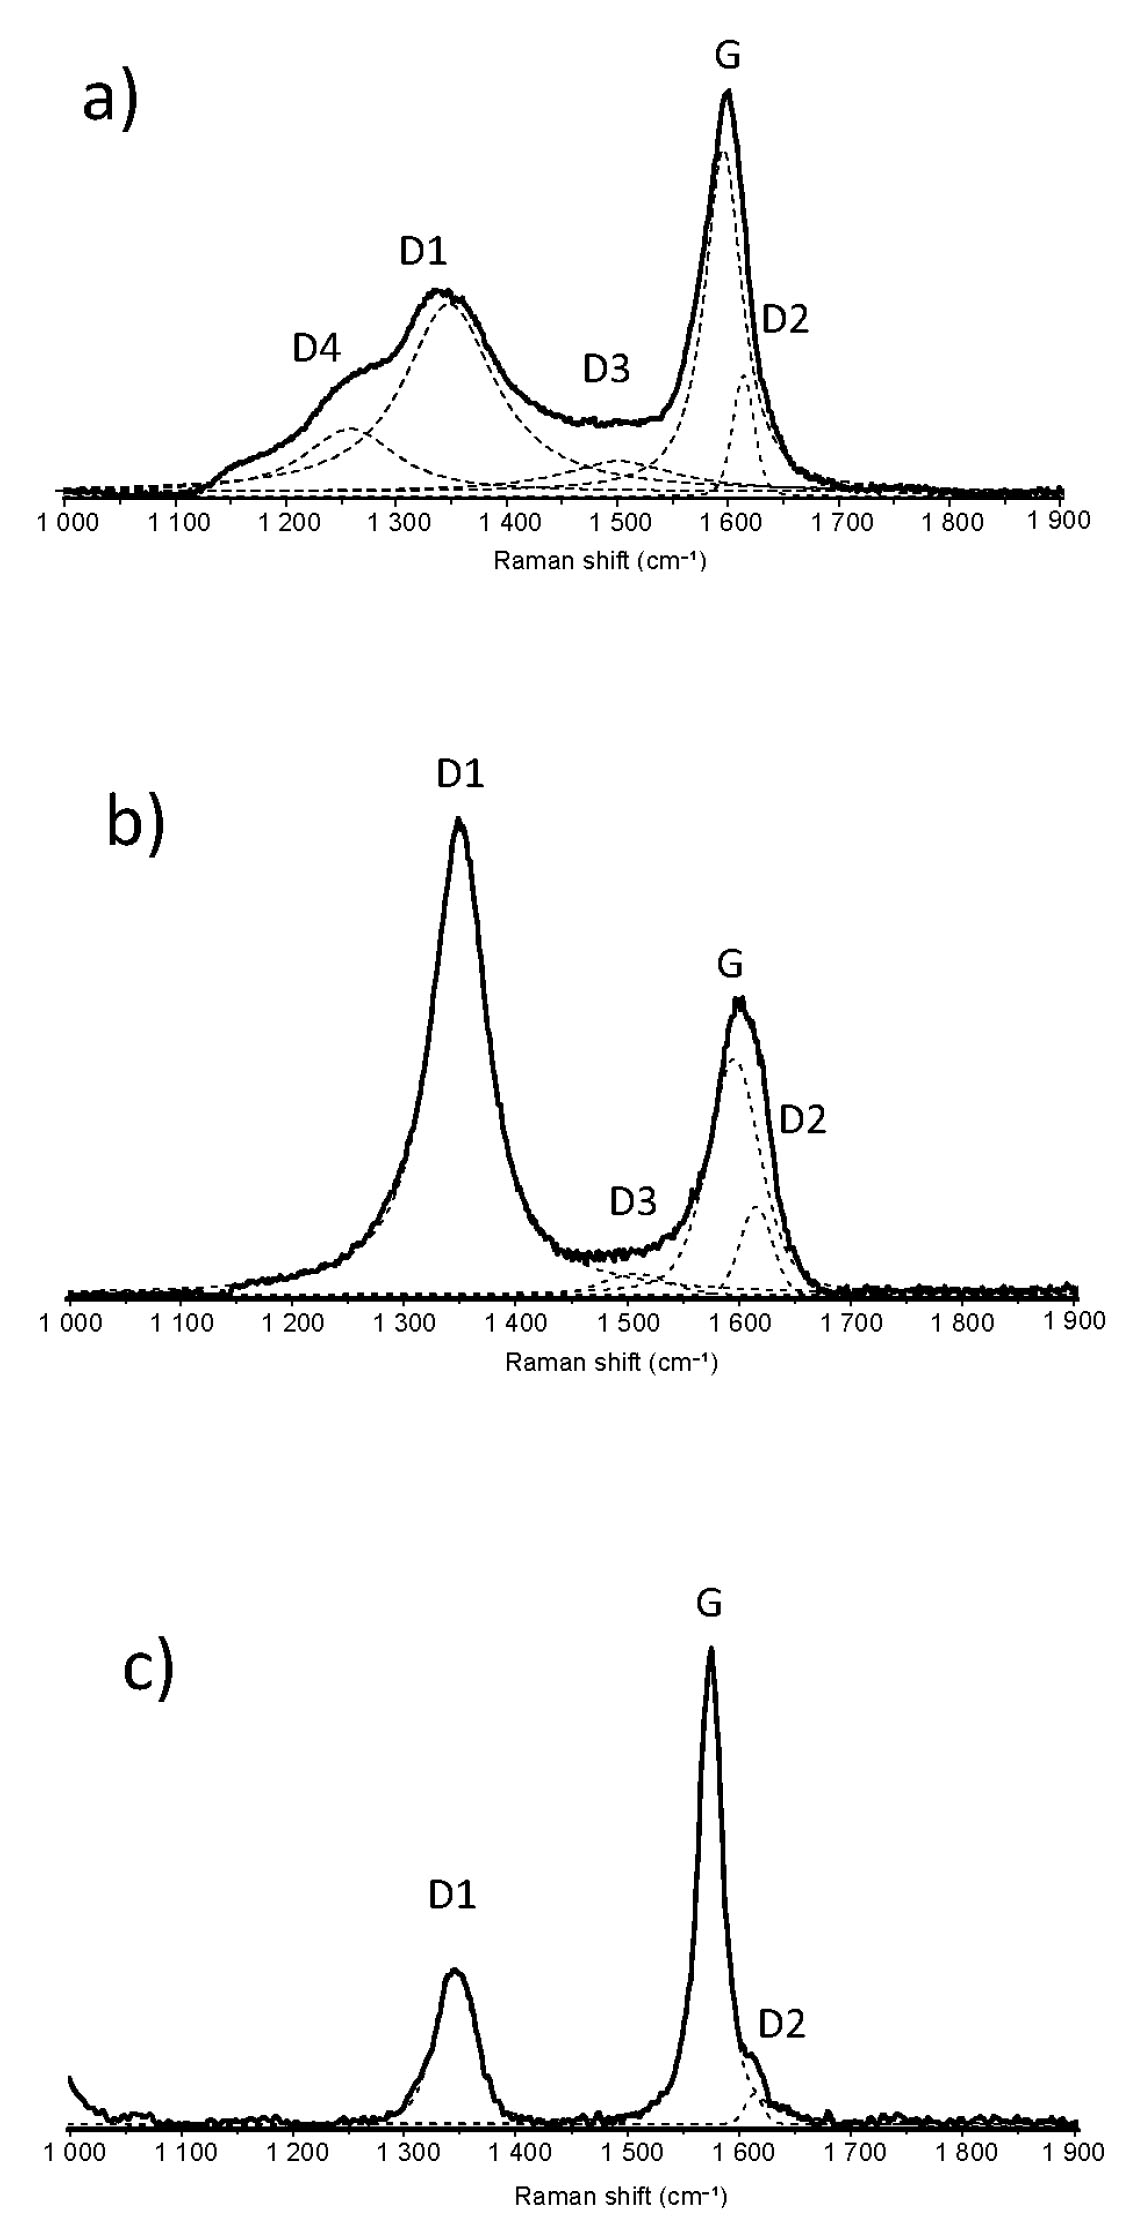
The Raman spectrum of carbonaceous material consists of two main bands at ~1585 cm-1 (the graphite peak, G) and ~1350 cm-1 (the disorder peak, D; Tuinstra & Koenig, 1970). These bands occur as the result of the hybridised atomic orbital configuration of carbon atoms and the relative amount of sp2 carbon bonds (graphite-like, trigonal planar symmetry) bounded by sp3 sites (diamond-like, tetrahedral symmetry; Robertson & Oreilly, 1987). The G band is assigned to the E2g symmetry in-plane vibration of the carbon atoms in the graphene sheets. On the other hand, the D band has been interpreted either by double resonant Raman scattering (A1g-mode of small graphite crystallites; Thomsen & Reich, 2000) or to ring breathing vibration in the graphite sub-unit or polycyclic aromatic compounds (Castiglioni et al., 2001; Di Donato et al., 2004; Negri et al., 2004; Lünsdorf, 2016). Their mutual relationships change with maturity level of organic matter (i.e., temperature; Tuinstra & Koenig, 1970) up to the graphitic stage (Beyssac et al., 2002). The number of bands that composes the carbonaceous material Raman spectrum, decreases with increasing ordering (i.e. temperature increase) passing from more than five bands in diagenetic organic matter to a single band in pure graphite (Fig. 4; Henry et al., 2019 for a complete review).
- Examples of Raman spectra and related bands assignment for different temperature intervals in the Internal Rif chain. a) Very disordered Raman spectrum from Carboniferous pelites of the Akaili Unit (Ghomarides); b) spectrum from Silurian shales of the Akaili Unit (Ghomarides); c) spectrum of graphitic carbon from the Filalì Unit (Sebtides).
Analyses in this work were performed on petrographic thin sections according to recommendation in Beyssac et al. (2002) and Lünsdorf et al. (2017), using a Jobin Yvon micro-Raman LabRam system with a Neodymium-Yag laser of 532nm (green laser) as a light source and a CCD detector. Spectra were acquired in the first order Raman spectral range (700 to 2300 cm-1). The power of the laser was 40mW and was reduced to less than 0.4 mW by optical filters to avoid heating alteration of the organic matter. The integration time for each data was of 20 s repeated for three times under a 50x magnification lens (as defined by Schito et al., 2017).
Temperatures were derived according to two different approaches in order to check the comparability between the relatively new method of Lünsdorf et al. (2017) with the classic fitting approach proposed by Beyssac et al. (2002) for high metamorphism or by Lahfid et al. (2010) for low metamorphism. The automatic method proposed by Lünsdorf & Lünsdorf (2016) and Lünsdorf et al. (2017) is designed to offer a comparability of Raman results at different stages of “organic metamorphism”. The method is based on the IFORS software that curve-fits Raman spectra of carbonaceous material modelling simultaneously the background with a fifth-order polynomial curve and the Raman signal with pseudo-Voight bands. The optimization of the curve is an iterative process that adds pseudo-Voight functions (note that the number of bands is not imposed a priori) until the best-representation of the baseline-subtracted spectrum is reached (Lünsdorf & Lünsdorf, 2016; Lünsdorf et al., 2017). Among Raman parameters carried out from this process, the normalized intensities of the D and G bands (STA-D, STA-G) are used to calculate paleo-temperature by means of the third-degree polynomial equation proposed by Lünsdorf et al. (2017). The correlation against temperatures provided in Lünsdorf et al. (2017) is based on a reference series of 26 samples collected across the central and western Alps in a range comprised between 100 and 700°C.
RA2 or R2 parameters and related paleo-temperatures, were calculated, depending on the shape of the spectra, by means of a four-to-three bands deconvolution as suggested by Beyssac et al. (2002) for graphitic carbon (Figs. 4b and c) or by a five bands deconvolution proposed by Lahfid et al. (2010) for low-metamorphic organic matter (Fig. 4a). Bands deconvolution was performed using LabSpec software by Horiba. Paleo-temperatures were calculated according to the following equations:
T °C=−445×R2+641(1) T °C=RA2−0.270.0045(2)RESULTS
TOC data in Sebtide samples indicate values between 0.7 and 0.8% except for sample 12.1 from the Beni Mezala 2 Unit where TOC is higher than 2%. In the Ghomarides, samples show values ranging between about 0.6 and 3.9% in the Akaili Unit and between 0.6 and 1.6% in the Beni Hozmar Unit, generally indicating high organic carbon conteet (Tab. 2).
| Sample | Unit | TOC (%) | T°C mean (LÜNSDORF et alii, 2014) | std T°C | R2/RA2* | std R2/RA2* | T°C mean RA2/R2 | std T°C | n° of spectra |
|---|---|---|---|---|---|---|---|---|---|
| Mar 8.1 | Beni Mezala 1 | 0.4 | n.d. | n.d. | n.d. | n.d. | n.d. | n.d. | n.d. |
| Mar 12.1 | Beni Mezala 2 | 2 | 365.21 | 19.75 | 0.62 | 0.03 | 365.52 | 14.26 | 20 |
| Mar 1.1 | Tizgarine | 0.7 | 324.62 | 17.39 | 0.68 | 0.01 | 337.87 | 6.80 | 20 |
| Mar 1.2 | Tizgarine | 0.8 | 325.64 | 16.66 | 0.66 | 0.04 | 332.19 | 10.31 | 22 |
| Mar 10.1 | Akaili | 0.7 | 298.11 | 15.39 | 1.62 | 0.07 | 300.91 | 15.97 | 32 |
| Mar 9.1 | Akaili | 0.8 | 197.00 | 13.72 | 0.89 | 0.13 | 195.22 | 29.35 | 21 |
| Mar 6.1 | Akaili | 0.4 | 299.35 | 21.91 | 1.60 | 0.05 | 296.57 | 11.13 | 32 |
| Mar 5.1 | Beni Hozmar | 0.6 | 372.24 | 12.20 | 0.65 | 0.03 | 352.80 | 12.43 | 33 |
| Mar 3.1 | Beni Hozmar | 1.6 | 285.76 | 10.95 | 1.57 | 0.08 | 288.57 | 18.49 | 27 |
| Mar 4.1 | Beni Hozmar | 0.4 | 368.54 | 15.52 | 0.64 | 0.02 | 356.30 | 11.01 | 28 |
| Mar 14.1 | Akaili | 1.5 | 246.55 | 8.93 | 1.14 | 0.14 | 246.86 | 30.96 | 21 |
| Mar 15.1 | Akaili | 1.9 | 295.71 | 18.98 | 1.64 | 0.08 | 304.79 | 18.87 | 35 |
| Mar 17.1 | Akaili | 0.7 | 368.27 | 9.38 | 0.65 | 0.03 | 380.84 | 8.02 | 22 |
| Mar 18.1 | Akaili | 3.9 | 342.46 | 15.28 | 0.66 | 0.03 | 347.64 | 11.70 | 24 |
| Mar 19.1 | Akaili | 1.2 | 442.23 | 13.16 | 0.64 | 0.03 | 446.34 | 7.67 | 22 |
| Mar 20.1 | Filalì | 0.7 | 488.07 | 5.71 | 0.36 | 0.06 | 486.15 | 6.67 | 14 |
Between 14 to 35 Raman spectra on organic fragments were acquired for each sample, to obtain a reliable temperature estimation (Table 2). High fluorescing spectra with a low signal-to-noise ratio were discarded after acquisition during a first qualitative evaluation.
In zone 1, Raman spectra on organic matter from the BM 2 Unit show a well-developed D band and a strongly asymmetric G band due to the presence of a clearly defined D2 band. In the Tizgarine Unit, the G band shows lower intensities with respect to the D band and the D2 band shows lower intensities and wavenumber position. Such features correlate to paleo-temperatures of approximately 365°C in the BM 2 Unit and between 324 and 337°C (according to different approaches, see Tab. 2) in the Tizgarine Unit.
In zone 1, samples 10.1, 6.1 and 9.1 from the Ghomarides show very different spectral features. Spectra in sample 10.1 and 6.1 are characterized by two well-developed D and G bands with similar intensities (Fig. 5a), whereas in sample 9.1 the G band shows higher intensities with respect to the D band and a shoulder toward lower wavenumbers occurs on the D band (Fig. 5c). Such differences, shown in Figs. 5a and c, correspond to a drop of more than 100°C between Lower Paleozoic (300-305°C in 10.1 and 296-299°C in 6.1) and Carboniferous samples (195-197°C in sample 9.1). A similar interval gap was also observed in the Beni-Hozmar unit where paleo-temperatures range between 352 and 372°C in the Silurian sample 5.1 and between 285 and 288 °C in the Carboniferous sample 3.1 (Tab. 2 and Figs. 5b and d).
- Differences between Carboniferous and pre-Carboniferous Raman spectra in the Akaili and Beni-Hozmar Units.
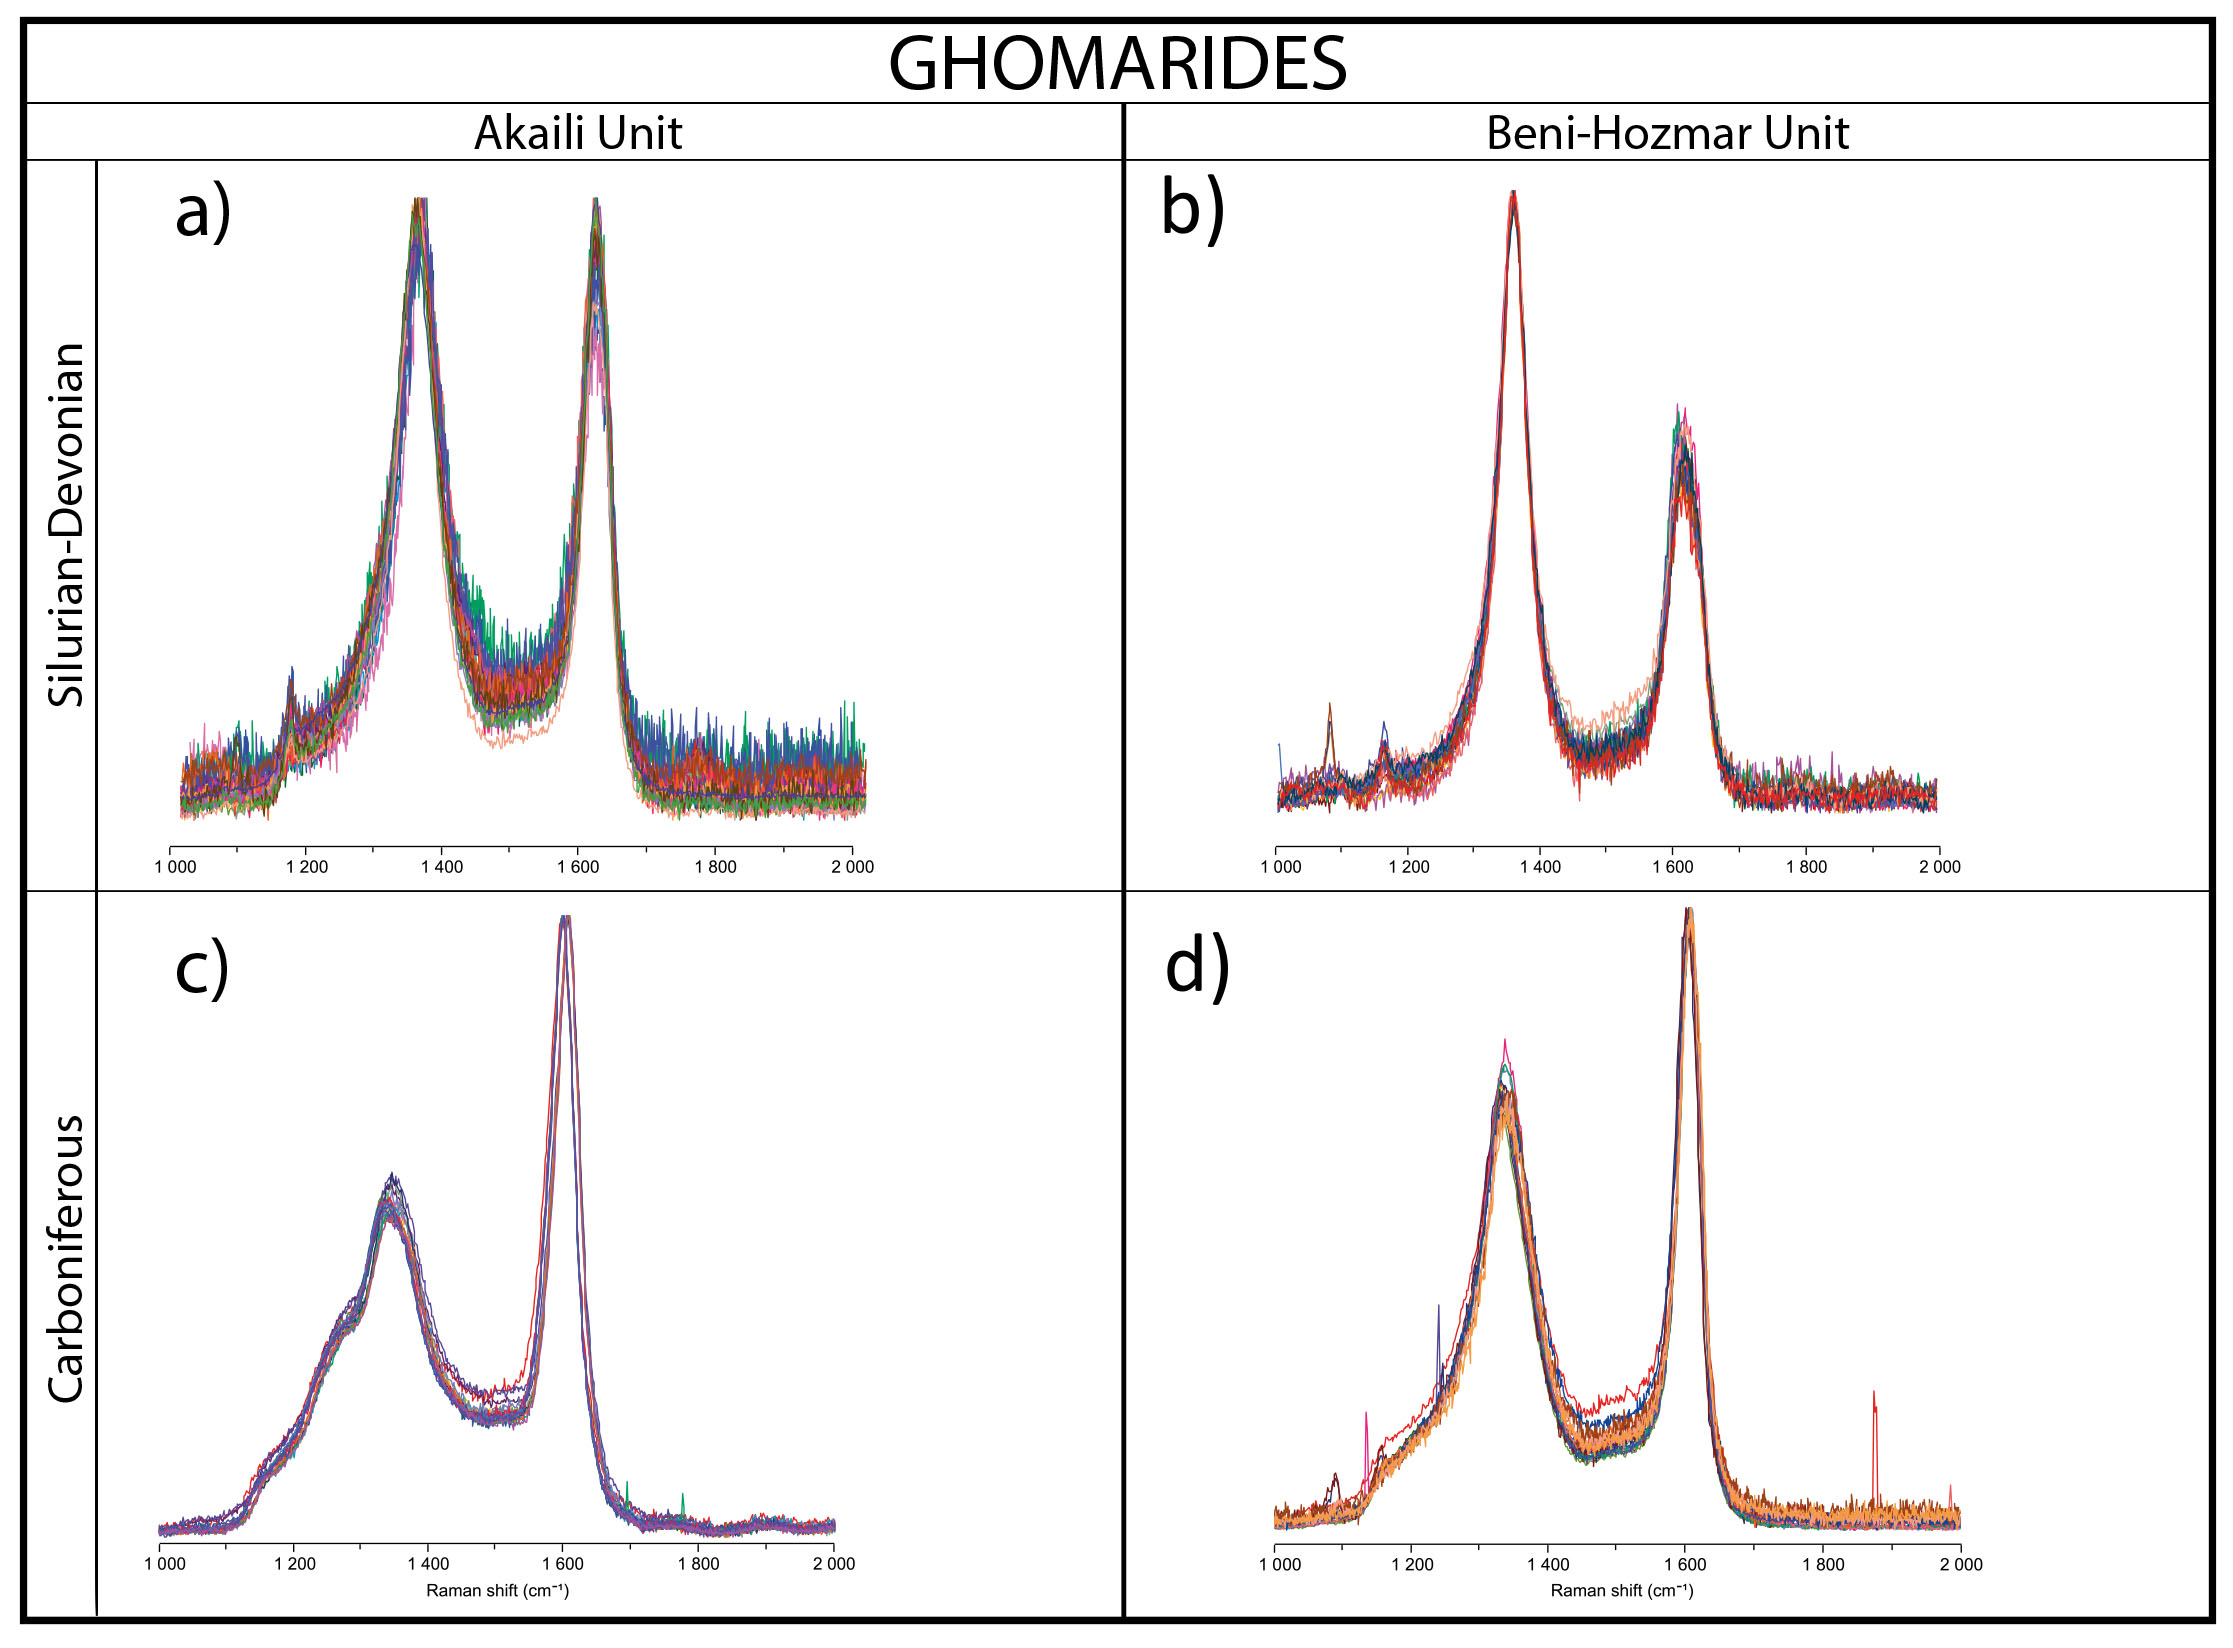
In zone 2, the only sample from Filalì unit shows spectra at an advanced stage of graphitization, characterized by a narrow G band with higher intensities with respect to the D band corresponding to temperature of 486-488°C (Fig 4c). Moving toward the NE in the Ghomarides, Raman spectra show a progressive increase of structural disorder with the increase of the D band intensity in samples 18.1 and 17.1 and with a broadening of both G and D bands in samples 15.1 and 14.1. Raman temperatures indicate a temperature decrease from the SW to the NE passing from 442-446°C in sample 19.1, to 340-370°C for samples 18.1 and 17.1 and 246-304°C at 15.1 and 14.1 sampling sites (Fig. 6, Tab. 2).
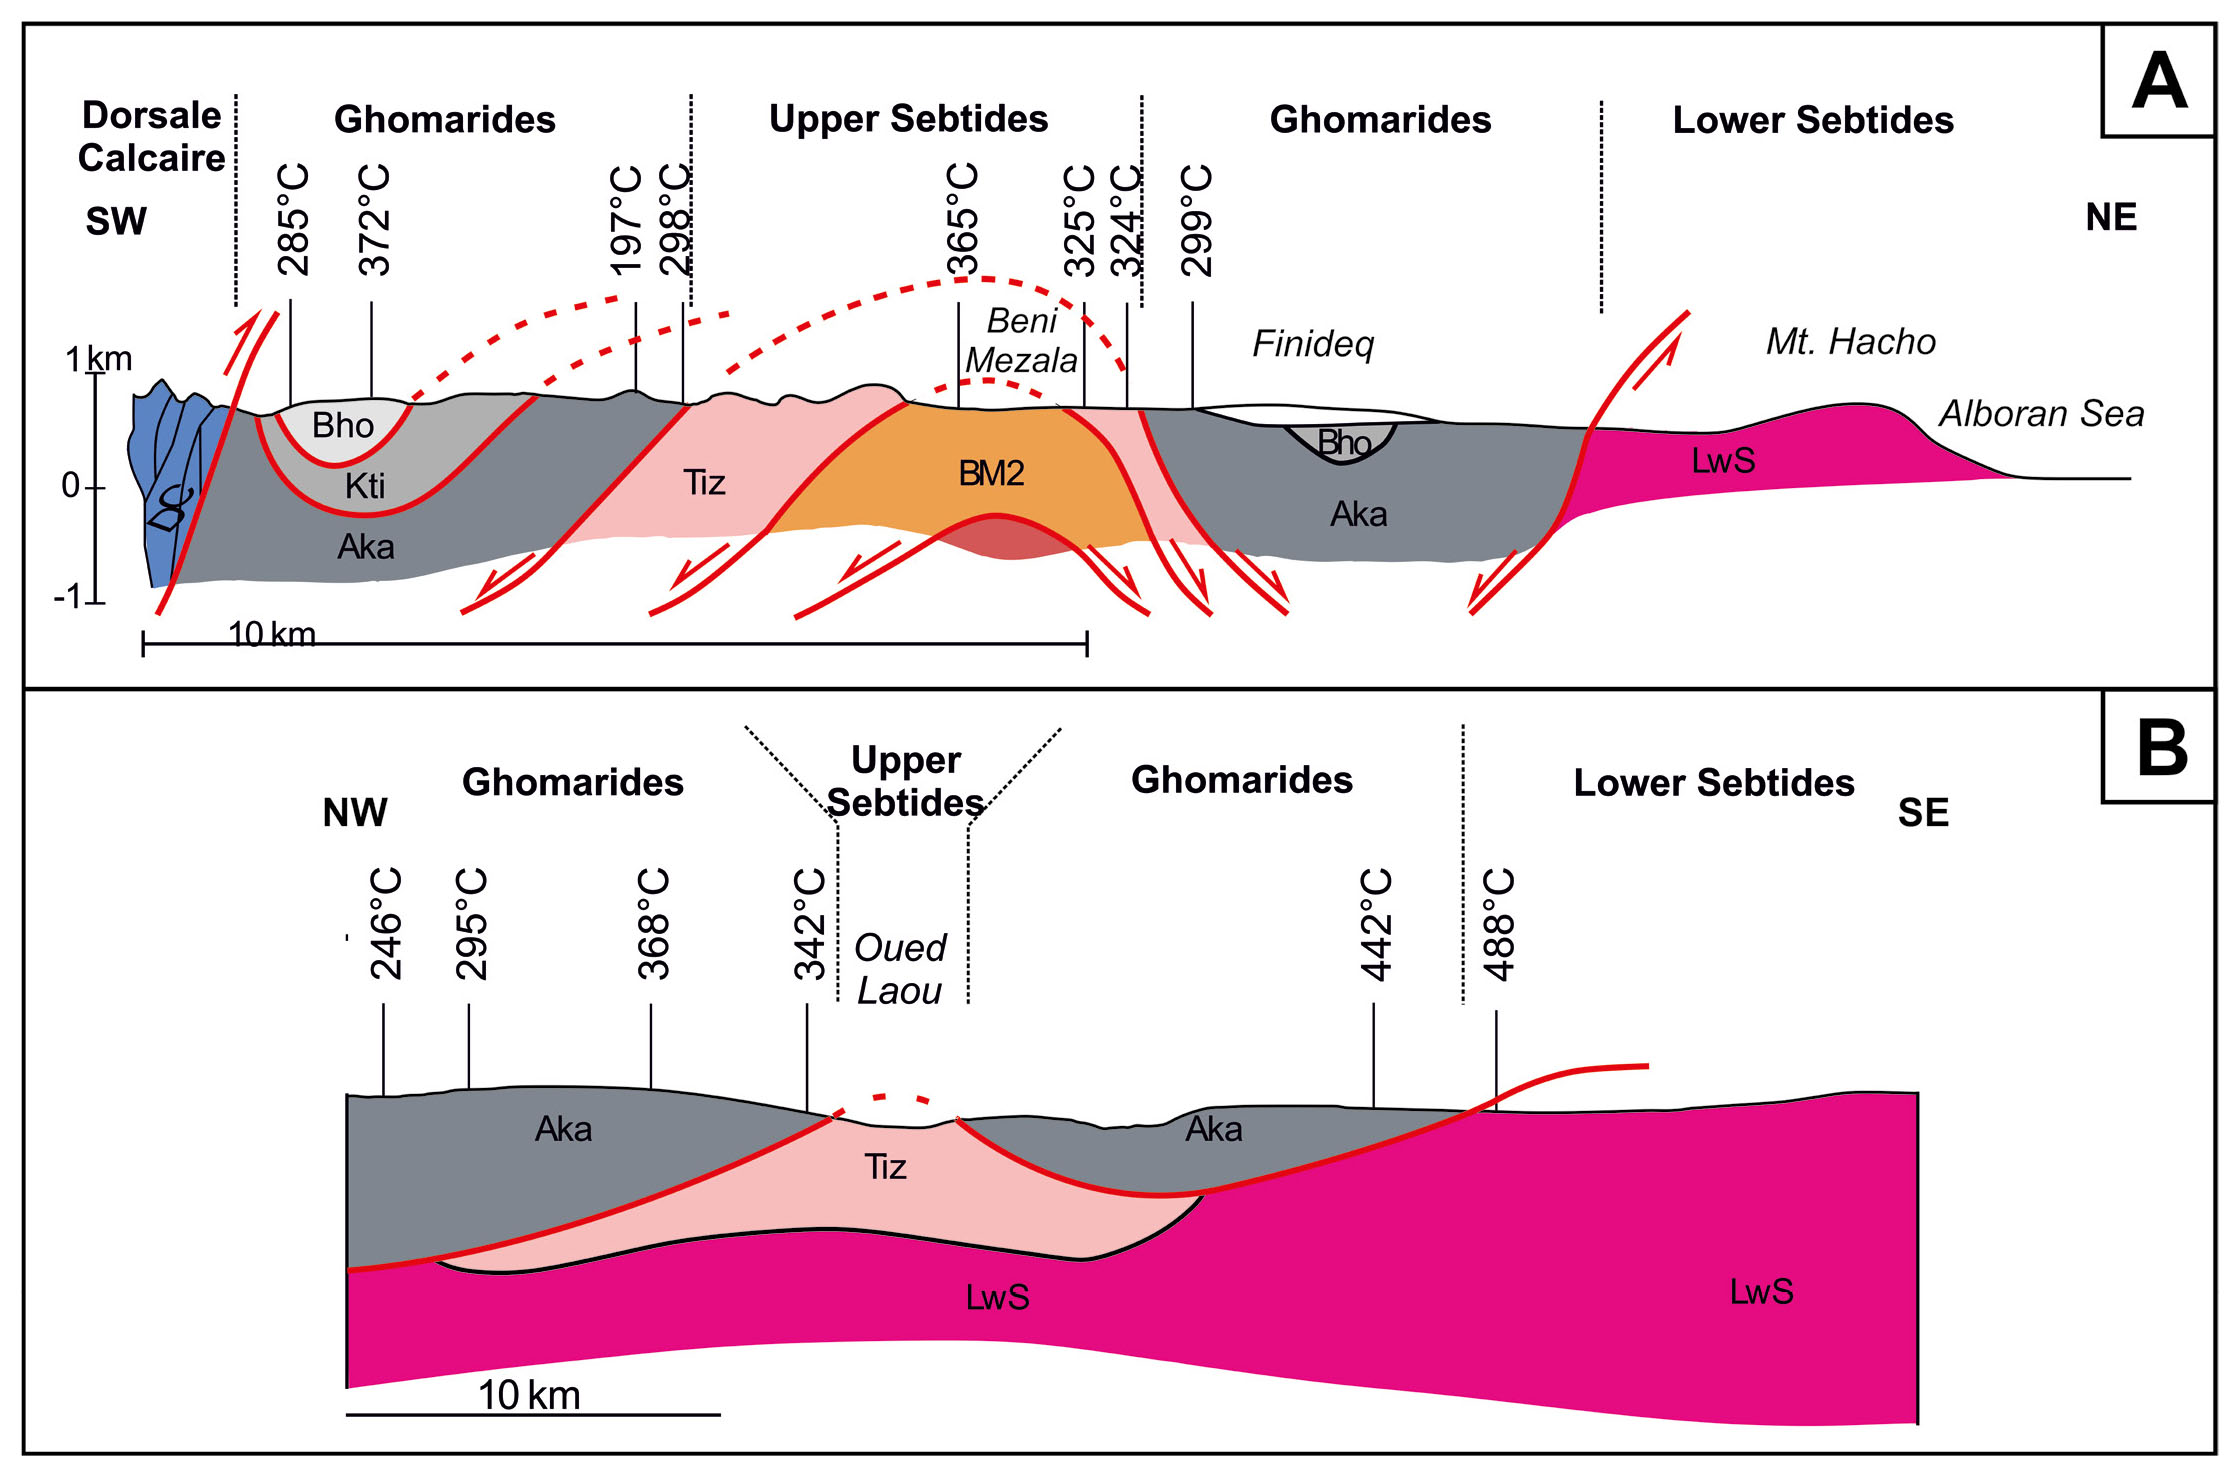
- Raman-derived temperatures plotted on cross-sections 1 and 2 located in Fig. 1. Redrawn and modified after Negrò et al., 2006 and Chalouan et al., 2008. Temperature shown in the figure are derived from the IFORS software (Lünsdorf & Lünsdorf, 2016). For comparison with other RSCM approaches see Table 2 and section 6.1. Acronysms: DC – Dorsale Calcaire; BHo – Beni Hozmar; KTi – Koudiat Tiziane; Aka – Akaili; Tiz – Tizgarine; BM2 – Beni Mzala; Lws – Lower Sebtides.
DISCUSSION
RSCM temperatures
The RSCM geothermother is one of the most used methods to assess the peak temperatures reached during prograde metamorphism (see Henry et al., 2019 for a complete review). It is based on the variation of the Raman spectrum of graphitic carbon at increasing temperatures, detected by curve-fit derived parameters (Pasteris & Wopenka, 1991). Different correlations between Raman parameters and temperatures have been proposed depending on the fitting approach and the metamorphic types and degree (Beyssac et al., 2002; Aoya et al., 2010; Lahfid et al., 2010; Lünsdorf et al., 2017; Mori et al., 2017; Henry et al., 2019; Li et al., 2020). Among them the most used are those of Beyssac et al. (2002) and Lahfid et al. (2010), based on the R2 and RA2 parameters for high and low-grade metamorphism, respectively. At the highest-grades, CM spectrum is composed by one band in pure graphite and by four bands at about 330°C (Beyssac et al., 2002), while in the interval between 200 and 320°C it can be adequately fitted with five Lorentzian bands (Lahfid et al., 2010). While this fitting approach has been successfully applied in a number of studies (Beyssac et al., 2004, 2019; Negrò et al., 2006; Galy et al., 2008; Delchini et al., 2016; Cochelin et al., 2018; Lahfid et al., 2019, among others) it has been demonstrated that the parameters calculation can be strongly influenced by the operator fitting approach (Lünsdorf et al., 2014). For this reason an automatic method has been proposed by Lünsdorf & Lünsdorf (2016) to provide higher comparability to the RSCM geothermometer.
In this work, the automatic approach of Lünsdorf & Lünsdorf (2016) is particularly suitable since many samples lie in the paleo-temperature range between 300 and 350°C (Tab. 2). This is the interval where the two geothermometers by Beyssac et al. (2002) and Lahfid et al. (2010) overlap and the choice of a bad fitting approach can lead to paleo-temperatures misinterpretation. Nevertheless, in order to constrain as much as possible our thermal data and avoid errors that can derived from the automatic processing of some spectra with low signal-to-noise ratio (Fig. 5), the RSCM temperatures derived with the IFORS software have been double checked by calculating the R2 or RA2 ratio and derived paleo-temperatures. Results shown in Table 2 indicate that maximum differences reached 20°C only in sample 3.1 and that they are lower than 10°C in most of the dataset. This evidence indicate a general agreement in paleo-temperature results considering that the error of the RSCM methods is always comprised between 40-50°C (Beyssac et al., 2002; Lahfid et al., 2010; Lünsdorf & Lünsdorf, 2016).
The approach based on a comparative between two fitting procedures strengthen the quality of the data presented in this work and further confirms the validity of the IFORS software.
Thermal evolution of the Rif and comparison with previous works
The Rif-Betic orogen is a key area in the Mediterranean puzzle to decipher the western Mediterranean geodynamic evolution (Royden & Faccenna, 2018 for a review) and it offers the opportunity to study both exhumed root of the Alpine orogen (i.e. Sebtides) and terranes derived from the fragmented Variscan chain (i.e. Ghomarides).
The metamorphic evolution of the internal units of the Rif- Betic orogen has been the subject of detailed studies focused on the outcrops of Beni Mzala antiform and around the Beni Bousera peridotite (Kornprobst, 1974; Durand-Delga, 1980; Chalouan & Michard, 1990; Michard et al., 2006; Negrò et al., 2006; Chalouan et al., 2008; Platt et al., 2013; Marrone et al., 2021).
In the Federico Unit, cropping out at the core of the Beni Mzala antiform, paleo-temperatures derived from the analyses of carbonaceous material were not present in literature given the moderate-to-low TOC content (Negrò et al., 2006 and Table 2). Despite this, we were able to carry out enough CM spectra whose RSCM geothermometer shows values of about 320°C in the Tizgarine Unit and of about 365°C in BM 2 one. Data from Tizgarine Unit suggest that it suffered slightly warmer conditions than those calculated by the coockeite-pyrophillites-phengite association (about 300°C according to Bouybaouene et al., 1998). On the other hand, the average temperature calculated for BM2, even if slightly lower, seem to confirm the minimum temperatures of 380°C provided by the presence of relict Mg-Carpholite estimated by Bouybaouene et al. (1998) rather than those of 450°C calculated by Vidal et al. (1999) by means of Chl-Cld thermometer. Results for the BM2 should be considered only as a first approximation, since we were able to derive Raman maximum temperature only on one sample and therefore need to be further validated in the future.
In the Ghomarides cropping out on the flanks of the Beni Mezala antiform, Negrò et al. (2006) already provided Raman measurements on four samples from the Akaili Unit and on one sample from Koudiait Tiziane unit, suggesting temperature always below 330°C, as this is the lower calibration limit of the RSCM geothermometer based on R2 parameter proposed by Beyssac et al. (2002). This limit can now be overcome since new correlations at low metamorphism are now available in literature for low metamorphism (Rahl et al., 2005; Lahfid et al., 2010; LünsdorF et al., 2017) and in diagenesis (Schito et al., 2017; 2019; Henry et al., 2019) allowing to use the RSCM geothermometers in a variety of geological conditions (Muirhead et al., 2019; Kedar et al., 2020; Nirrengarten et al., 2020).
Our data on the Ghomarides in the northern sector of the Rif belt, outline a paleo-temperature jump between pre-Carboniferous and Carboniferous successions both in the Akaili and Beni Hozmar units. In detail, the maximum temperatures acquired during the Eo-Variscan phases by the pre-Carboniferous rocks are at the boundary between anchizone and epizone (about 300°C, Frey et al., 1987) in the Akaili Unit and in the epizone (about 370°C) in the Beni-Hozmar (Table 2 and Fig. 7). On the contrary, Visean rocks in the Akaili Unit show values typical of deep diagenetic/low anchizone conditions (about 200°C) reached during the late Variscan phase, while temperatures in rocks with the same age are about 280°C in the Beni-Hozmar unit. Previous data from illite crystallinity (Chaloüan & Michard, 1985) also indicated lower metamorphism for Carboniferous rocks in the Ghomarides, but with no significant differences among their units (Chalouan & Michard, 1985; Chalouan & Michard, 1990). Thus, our data show for the first time in detail the thermal structure across the Paleozoic Ghomarides, highlighting that the Beni-Hozmar Unit suffered metamorphism at higher temperatures with respect to the Akaili Unit both during Eo and Late Varsican events. It is particularly interestingly to note that almost the same gap in paleo-temperatures between 80 and 100°C is recorded above and below the Variscan unconformity among the two units and this could suggest that they kept some similar structural relationship during both events.
- Geological map of internal Rif with indicated Raman-derived maximum paleo-temperatures. Temperature shown in the figure are derived from the IFORS software (Lünsdorf & Lünsdorf, 2016). For comparison with other RSCM approaches see Table 2 and section 6.1.
As matter of fact very little is known about the Variscan history of the Palezoic units in the Ghomarides or in similar units in the Maghrebian chain. In the Malaguides (southern Spain), the pre-Alpine deformation in Paleozoic rocks is very poorly constrained (Martin-Algarra et al., 2009). HT/LP mineralogical assemblage, associated to paleo-temperatures of about 500°C were locally found in the lowermost Ordovician-Silurian rocks near the Ronda peridotite (Ruiz-Cruz & Galán, 2002; Ruiz-Cruz & Novák, 2003; Negrò et al., 2006), while clay mineralogical analyses (Abad et al., 2003) and CAI (Conodont Alteration Index) determination (Martin-Algarra et al., 2009) failed to precisely detect variation at lower paleo-temperature and the whole Palaeozoic section is generally described to have suffered achizone to epizone metamorphism. In both Greater and Lesser Kabylia (northern Algeria), similarly to the Ghomarides, Michard et al. (2006) describe a Late Devonian Eo-variscan phase that led to greenschists metamorphism and a Late-Variscan phase responsible for the folding of the unconformable Carboniferous deposits. These domains, together with the Calabria-Peloritan arc are thought to share a similar structural position in a western (southwestern? Raumer et al., 2002) sector of the Paleotethys, rather than in the Rheic realm such as other Variscan sectors in Iberia and Morocco (i.e., Balearic, Iberian and Moroccan mesetas), and to suffered similar metamorphisms (Chalouan & Michard, 1990; Raumer et al., 2002; Martin-Algarra et al., 2009). This hypothesis is mainly based on stratigraphic and structural affinities of the Paleozoic successions, even if at low metamorphic degree the lack of a more comprehensive dataset hampers a full understanding. The RSCM approach proposed in this work has shown to be promising. Thus, it could be applied in similar areas and provide evidence (or not) of a common metamorphic history of the Variscan terranes in the Mediterranean area.
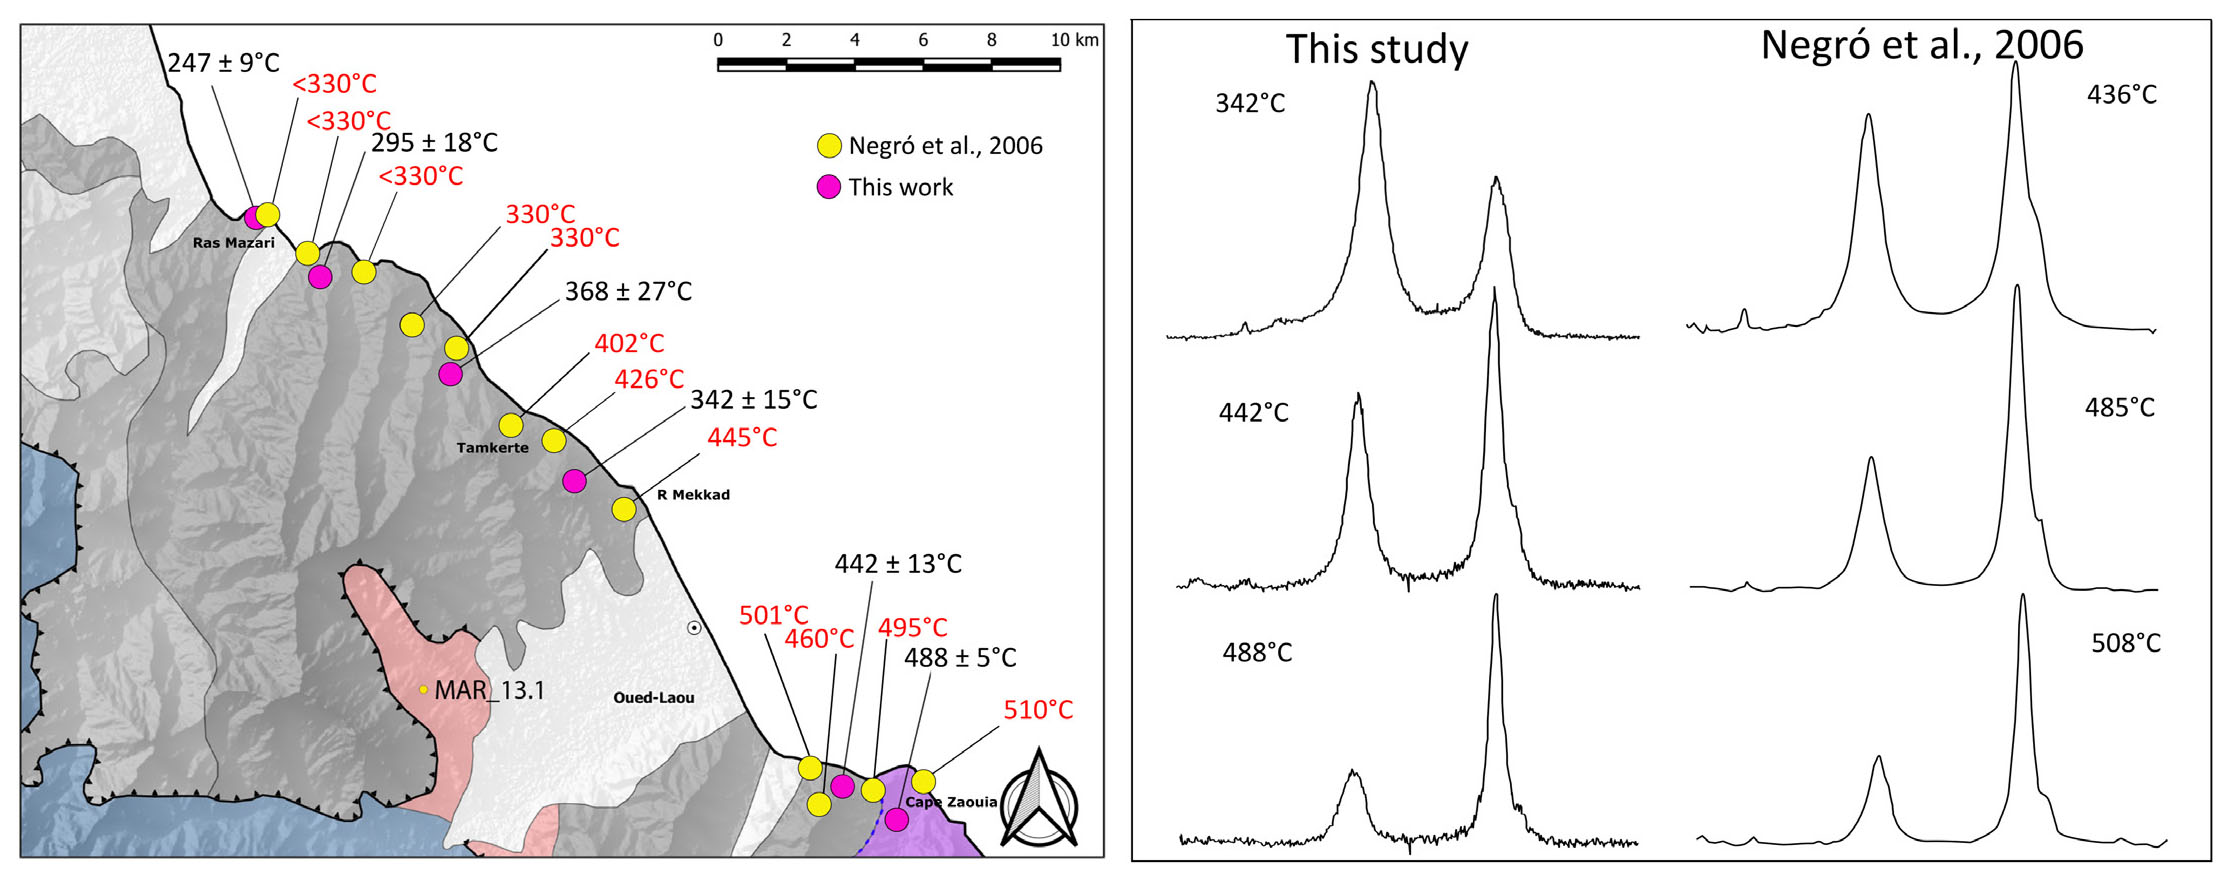
In the southern sector (Zone 2), samples were collected along the route from Ras Mazari to Cape Zaouia (Fig. 7). The main contribution of this work was to unravel paleo-temperatures for the Devonian and Carboniferous rocks (samples 15.1 and 14.1) that were previously reported to be lower than 330°C by Negrò et al. (2006). New data show a jump in paleo-temperature of about 50°C between Carboniferous and Devonian rocks moving from Ras Mazari to Tamrabete area south of Tetouan town (Fig. 7). This gap is lower than that observed in the northern sector for the Akaili unit. Moreover, the observation that paleo-temperatures of the pre-Carbonifeous samples are similar, suggest that Carboniferous rocks here experienced higher thermal stress probably due to a Late Oligocene (Early Miocene?) thermal event that affected the area (see discussion below).
As matter of fact, Michard et al. (2006) showed in this area that K/Ar on white mica isotopic ages tend to increase moving from the Ghomaride–Sebtide tectonic contact (Zaouia Fault, 25My) to the Ras Mazari area where the apparent ages are of about 183 My. This age distribution, coupled with the increase of Raman temperature from Ras Mazari to the Zaouia Fault (Fig. 8 from Negrò et al., 2006) has been interpreted as a thermal event connected to the emplacement of the Beni-Boussera peridotites. Nevertheless, recent works recently questioned the hypothesis of “hot” exhumation of the Rif–Betic peridotites during the Alpine orogeny (Rossetti et al., 2020; Farah et al., 2021). By means of geochronological data on the migmatitic rocks that form the envelopment of the Beni Bousera peridotite, Rossetti et al. (2020) point out a main Hercynian thermal event, associated with intra-crustal emplacement of the peridotite, followed by cooling and exhumation from deep to shallower crustal conditions. The final stage of exhumation is constrained by the authors to the Early Miocene and is coeval with the main stage of the Alboran basin back-arc extension. At this time, the westward retreat of the Tethyan subduction caused lithosphere delamination and asthenosphere upwelling that led to crustal partial melting and diffuse magmatism as outlined by the andalusite-bearing dykes that intruded the Beni Bousera units (Rossetti et al., 2013). All these pieces of evidence suggest that the thermal gradient depicted by Raman data in the present work and in Negrò et al. (2006), as well as the thermal reset of the K/Ar on white mica isotopic ages (Michard et al., 2006), related to an Alpine HT metamorphic event that is independent from the peridotite emplacement. Given this, our data show some differences with respect to the paleo-temperature pattern provided by Negrò et al. (2006). This can be observed, particularly, in the area between Ras Mazari and R Mekkad, where paleo-temperatures estimations differ for more than 100°C (Fig. 7). Considering that we followed the analytical procedure for Raman spectra acquisition by Beyssac et al. (2002), a possible source of error could be envisaged in different fitting methods. However, in our case,the paleo-temperatures from R2 shown in Tab. 2 show a very good agreement with to those calculated with the IFORS software, strengtening our results. The fitting procedure or the user interpretation could in part justify differences observed among similar spectra as shown in Fig. 7b (comparison spectra at 442-485°C and 488-508°C) but cannot be held responsible for spectra related to samples near Tamkerte, which show very different features. In this case, the differences are due to different heating conditions (Fig. 8b). Working with organic matter, differences in thermal maturity (maximum paleo-temperature) can be usually ascribed to the presence of reworked material (Laczo & Jambor, 1988; Lucca et al., 2018; Qin et al., 2018; Balestra et al., 2019), but this does not seem to be the case, since spectra in our samples are very homogeneous. This piece of evidence suggests that paleo-temperatures in this sector of the Ghomarides, has higher spread than previously assessed. One possible explanation for this spread could be the effect of localized shear/strain (Kitamura et al., 2012; Kuo et al., 2014, 2017; Kedar et al., 2020) that could have locally increased the thermal stress. Moreover, as shown by Münch et al. (2021) in the area near Ceuta town, the internal zone of the Rif chain has been dissected by E-W and NNW-SSE normal faults between about 18 an 11 My and this can explain why a regular trend of increasing paleo-temperatures from Ras Mazari to Cape Zaouia has not been detected (Fig. 8).
- a) Raman paleo-temperatures from this work and from Negrò et al. (2006), plotted in zone 2 for comparison. b) Comparison between Raman spectra and related paleo-temperatures from this work and Negrò et al. (2006). Spectra on the same row correspond to samples from the same sampling area. Paleo-emperature shown in the figure are derived from the IFORS software (Lünsdorf & Lünsdorf, 2016). For comparison with other RSCM approaches see Table 2 and section 6.1.
CONCLUSION
In this work we implemented the paleo-thermal database of the Internal Rif in Morocco providing a new set of data in the Sebtide and Ghomaride successions through Raman spectroscopy on dispersed organic matter. In the upper Sebtides cropping out in the Beni Mezala antiform we show that Tizgarine and BM 2 Units experienced maximum paleo-temperature of about 320 and 370°C, respectively. In the same area, data from Ghomarides show a temperature jump across the Eo-Variscan unconformity in both Akaili and Beni Hozmar Units. Interestingly, our data also indicate higher paleo-temperatures in Beni Hozmar suggesting higher metamorphic conditions suffered by this unit.
In the southern area between Ras Mazari and Cape Zaouia, samples collected from the Akaili Unit show increasing paleo-temperatures moving towards the tectonic contact with the Filalì Unit connected with a Late Oligocene high temperature metamorphic event not related to emplacement of the Beni-Bousera peridotite.