
INTRODUCTION
Understanding the timescale of deformation is essential for unravelling the processes involved in mountain building and the exhumation of metamorphic rocks, whether they have undergone metamorphism under low-to-medium-grade or under high-pressure and/or temperature conditions.
Shear zones are physical manifestations of the localisation of lithospheric deformation and their study constrains deformation and metamorphic histories (e.g., Ramsay, 1980; Passchier & Trouw, 2005; Fossen & Cavalcante, 2017). Shear zones are tabular zones within the lithosphere where strain is localised relative to the surrounding less deformed areas, primarily involving simple shear (i.e., non-coaxial deformation), though a component of pure shear (i.e. coaxial deformation) is typically present (Fossen & Cavalcante, 2017, with references). Shear zones represent the deeper equivalents of upper crustal faults and fault zones across contractional, extensional, and strike-slip settings. Despite occupying a small volume of the Earth’s lithosphere, they play a key role in shaping it by facilitating rock transfer and fluid migration. Therefore, determining the age and duration of shear zone activity is a major goal in studying the evolution of orogens and in extended and hyperextend margins as well, which are expressions of the Earth’s lithospheric deformation (e.g., Naumenko-Dèzes et al., 2020; Carosi et al., 2022).
This task is further complicated by multiple stages of overprinting deformation, leading to repeated mineral growth and the development of distinct fabrics representing different deformation conditions (such as prograde and retrograde metamorphism), which often intricately coexist, creating complex fabric architectures (e.g., Di Vincenzo et al., 2004; Oriolo et al., 2018; Montemagni et al., 2019; Montomoli et al., 2024). Recrystallisation is indeed often incomplete, resulting in a mixture of inherited and newly formed mineral phases. Low-temperature sub-microscopic alteration of fine-grained fault gouges adds complexity, as it often can only be detected by a dedicated search. Therefore, an integrated approach that combines geochronology with detailed microstructural and petrographic analysis (Di Vincenzo et al., 2001, 2004; Vance et al., 2003) is crucial for obtaining structurally constrained ages from the rock record.
Micas, commonly found in polydeformed and metamorphic sheared rocks due to their stability across a broad range of pressure-temperature (P-T) conditions (Guidotti, 1984), play a crucial role in reconstructions of the metamorphic history of orogens (Di Vincenzo et al., 2022 and reference therein). They can (re)crystallise during deformation, preserving valuable information about the timing of such events (Lanari et al., 2014). Their high potassium content makes them ideal for 40Ar/39Ar dating, enabling the use of both furnace and laser extraction techniques (Müller et al., 2002; Kellett et al., 2024).
In this paper, we aim to review the challenges of dating deformation events in polydeformed terrains documented by mineral growth during shear zone activity using the 40Ar/39Ar method. We explore the different techniques, which have been implemented in the recent years, each with its own advantages and limitations, along with examples of their application.
STATE OF THE ART
Among the many geochronological systems, the 40Ar/39Ar method (Merrihue & Turner, 1966) is based on the natural decay of 40K to 40Ar with a half-life of 1.25 Ga (billion years) (Steiger & Jäger, 1977), and thus is applied to K-bearing minerals such as micas (white micas, biotites, illite/smectite clays), alkali feldspars, plagioclases, amphiboles, and glass.
The 40Ar/39Ar method
The 40Ar/39Ar method is based on irradiation by fast neutrons, during which some of the 39K in the sample undergoes the reaction 1939K (n,p) 1839Ar (Merrihue & Turner, 1966). Thus, 39Ar proxies for the radioactive parent 40K, as the 39K/40K is constant to a few tenths of permille in the entire Solar System. Since the radiogenic daughter, 40Ar*, is also an isotope of the same element, after irradiation the parent and daughter isotopes can be measured simultaneously. The ratio of the two isotopes of argon, 40Ar*/39Ar, is thus proportional to the age of the sample. The equation of the Ar-Ar age is
t=1λln[ 1+J40Ar*39Ar ] [1]where λ is the total decay constant of 40K and J is a measure of the neutron fluence received by the sample and is determined by analyzing mineral monitors of known age that have been irradiated together with the sample to be dated.
The 40Ar/39Ar method is one of the most powerful dating techniques for two reasons, one pertaining to precision, the other to accuracy. Firstly, it is applicable to a wide range of geological problems and to a wide range of minerals spanning from a few thousand years (e.g., the age of the Vesuvius eruption in 79 AD: Renne et al, 1997) to the beginnings of the solar system (e.g., the age of primitive meteorites: Renne, 2000). Samples are irradiated together with monitor minerals that constrain the irradiation dose and hence the age of the samples to be dated. Ideally, monitors are reasonably homogeneous minerals (Naumenko-Dèzes et al., 2018) whose age is known to about 1% (Renne et al., 1998, 2011; Rivera et al., 2011). The second reason that makes 40Ar/39Ar dating versatile is that Ar isotope systematics allow the identification of the mineral phases being degassed. This is due to an extremely important side-effect of the neutron irradiation, namely the production of 37Ar, 38Ar, and 39Ar from Ca, Cl, and K respectively. In the following sections we will repeatedly point out the essential role of compositional fingerprinting.
A very remarkable characteristic of the 40Ar/39Ar method is the possibility to perform both stepwise release analyses (Merrihue & Turner, 1966) and spatially resolved in situ dating (Megrue, 1973), and especially to couple the two complementary protocols by performing the two analyses on one and the same sample (Hodges et al., 1994; Müller et al., 2002; Di Vincenzo et al., 2022). The complementarity stems from the fact that each of the two analytical protocols can reveal some, but not all, the information on the analyzed mineral, as will be detailed below.
Analytical advances have had a significant impact on precision and accuracy of isotope analysis. These developments encompass enhanced mineralogical imaging techniques, a more profound comprehension of mineral microtextures, the use of multicollector mass spectrometery, and the refinement of in situ dating protocols. These advances have culminated in enhanced analytical precision, thereby facilitating a more detailed understanding of the multiple factors that control the retention of chronological information (e.g., Di Vincenzo et al., 2001, 2021; Tartèse et al., 2011; Bosse & Villa, 2019, and references therein), thereby improving the accuracy of the geochronological interpretations. The tuning of Cenozoic reference minerals using astronomical cycles (e.g., Kuiper et al., 2008; Niespolo et al., 2017; Di Vincenzo, 2022), offers improved intercalibration with other dating methods (U–Pb, Rb–Sr, etc., Kellett et al., 2024).
The sample chosen for analysis (mineral separates for stepwise heating, thick sections for in situ dating) is cleaned of loosely adhering phases by ultrasonic cleaning in deionized water and wrapped in high-purity aluminium foil for irradiation. After a suitable period (a few weeks) that allows the decay of short-lived artificial radionuclides produced from all major and trace elements contained in the mineral, samples are cleared for shipping to the geochronology laboratory. It is essential (Turner, 1988) to always measure all five Ar isotopes (i.e., 36Ar, 37Ar, 38Ar, 39Ar and 40Ar) because of the wealth of compositional, and therefore petrologic, information provided by their context.
Stepwise heating technique
The 40Ar/39Ar stepwise heating technique allows dating of K-rich mineral fractions that have been previously separated from the sample using crushing, sieving, magnetic and/or gravimetric separation techniques, and prolonged hand-picking (Montemagni & Villa, 2021). An important note of caution is that most minerals, both terrestrial and extraterrestrial, contain inclusions and intergrowths that are not visible in an optical microscope by the person attempting hand-picking (Heri et al., 2014; Naumenko-Dèzes et al., 2021). Claims of “handpicked to achieve 99+% purity” are always belied by the compositional signature provided by 37Ar–38Ar–39Ar systematics (see below).
In a stepwise heating analysis, Ar is gradually released from the sample by progressively increasing the temperature (in a vacuum furnace or by IR laser irradiation). The isotopic composition of Ar at each step is immediately analyzed (Müller, 2003). By using the compositional data derived from 37Ar, 38Ar, and 39Ar, each heating step can be associated with specific minerals in chemically heterogeneous samples (Villa et al., 2000). A key factor in establishing this connection is the use of electron probe microanalysis (EPMA) data, which should be compared with the Ca/K and Cl/K ratios derived from the 40Ar/39Ar analysis. The element maps obtained by EPMA can then associate the Ca/K and Cl/K ratios to other petrologically relevant compositional information, such as NaM4 (Villa et al., 2000), Ca/Al (Kreissig et al., 2001), Fe/Mg (Giuntoli et al., 2024). The use of compositional data to link microtextural, petrogenetic and isotopic constraints (e.g., Vance et al., 2003; Kylander-Clark et al., 2013; Villa & Williams, 2013; Rösel and Zack, 2022) is common to several dating methods and should be viewed as the most fruitful development of geochronology in the last 80 years. Petrological techniques such as pressure–temperature–water activity–composition (P-T-a-X) calculations (Powell & Holland, 1998; Lanari & Dusterhoeft, 2019) allow users to diagnose whether a rock has preserved a pristine status or has undergone retrograde reactions. This improvement of petrologic understanding ought to be taken into account in the interpretation of all studies involving real-world samples, especially including geochronometer minerals.
Stepwise heating is primarily used on separated minerals, as these offer a better control on their petrogenesis. It can also be used on aphyric rocks (e.g., Lanphere & Dalrymple, 1971) and on matrix material in case mineral separation is impossible, always keeping in mind that all isotope data unaccompanied by a petrological and microstructural context can lead to an inaccurate chronological interpretation. Compositional fingerprinting of alteration phases often allows a reliable age assessment even for altered rocks (Villa & Williams, 2013; Villa & Hanchar, 2017).
Since Ar is released by in vacuo heating of hydrous (Zimmermann, 1970; Villa, 2021) and anhydrous (McDowell, 1983; Villa et al., 2024) minerals by selective breakdown of crystal structures in narrow, mineral-specific temperature intervals, it is possible to assign the different ages of the different steps of Ar release (Rolland et al., 2009; Villa, 2015) to carrier phases characterised by different Cl/K (i.e. 38Ar/39Ar) and Ca/K (i.e. 37Ar/39Ar) ratios (Villa et al., 2014), unravelling petrological and chemical complexities.
A major limitation of the stepwise heating technique, when applied to metamorphic and mylonitic rocks deformed along shear zones, is the control of the hypothesised connection between the isotopic record and microstructures. Mineral separation by macroscopic physical means rarely allows different textural generations to be isolated from each other, as intergrowths very often occur on a micrometer scale (e.g., Airaghi et al., 2017; Montemagni & Villa, 2021; Giuntoli et al., 2024). Montemagni & Villa (2021) addressed the problem of multiple mica generations in shear zones, but their approach can be applied to any other polygenetic mineral mixture. They proposed a procedure that relies on the simultaneous acquisition of two different, complementary kinds of information:
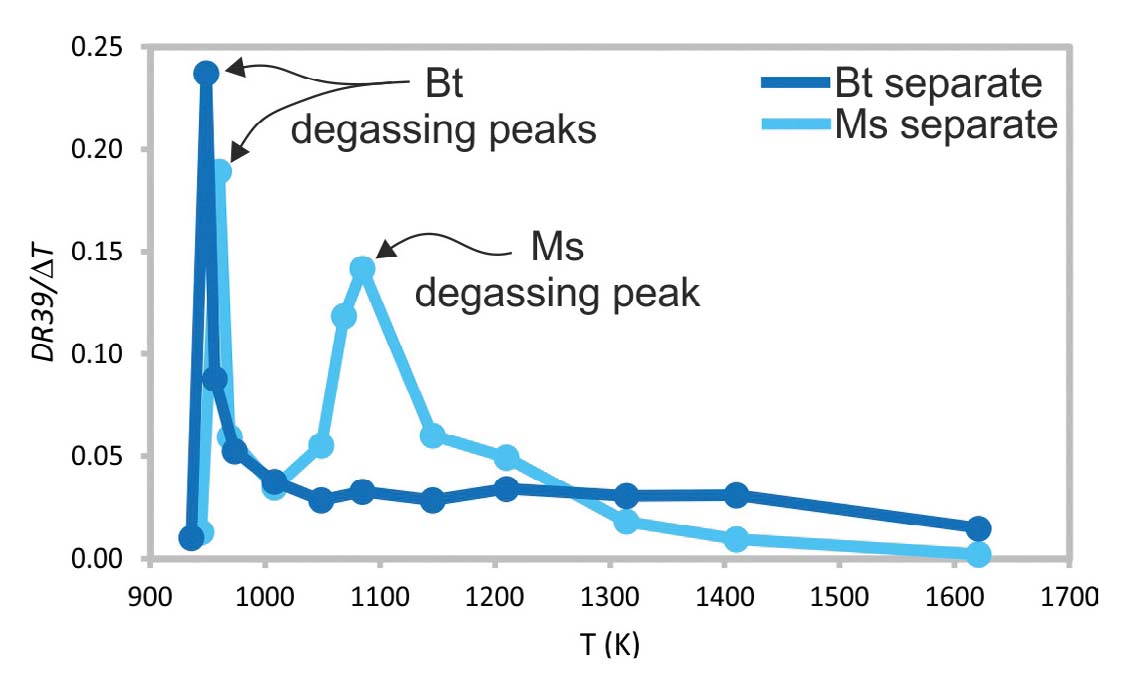
i. the first one is provided by the temperature dependence of the differential release of Ar from minerals during stepwise heating (Fig. 1). As stepwise heating is often performed with non-uniform temperature intervals, the differential 39Ar release of each step (indicated as DR39 and given in percent) ought to be normalised to the width ΔT of the temperature interval of the respective step. In the reasonable assumption that the prolonged hand-picking has achieved a substantial enrichment of the desired mineral (even if far from “99% purity”), the majority of the Ar released corresponds to the mica proper, and only a smaller fraction derives from intergrown retrogression phases and other impurities smaller than the visual recognition. Since mica structures dehydrate and collapse over a narrow temperature interval (Zimmermann, 1970), the largest peak in the differential release plot is likely to most closely represent the degassing of the pure mica under investigation.
ii. The second indication is provided by comparing the differential Ar release in different steps with the Ca/K and Cl/K ratios in the same steps: the steps most likely to yield a reliable step age are those released by the predominant mineral in the analyzed separate and at the same time those that have uniform Ca/K and Cl/K ratios closest to stoichiometry. In contrast, devious ratios indicate degassing of alteration and/or retrogression mineral phases (e.g., Simon-Labric et al., 2009).
- Differential Release plot for a mylonitic calcschist from the Munsiari Thrust (analyzed by Montemagni et al., 2020), containing easily separated, “pure” biotite as well as muscovite intimately intergrown with biotite, as testified by both the Bt and Ms peaks in the muscovite separate. The differential 39Ar release normalised to the step temperature interval for biotite shows a sharp peak at 950 K, followed by a low DR39/ΔT throughout all subsequent steps. The 39Ar release of muscovite, on the other hand, has two differential release peaks, one coincident with that of biotite, one around 150 K higher. The interpretation based on petrographic observations is that muscovite contains finely intergrown biotite layers. Data from Montemagni (2020).
A way to display the Ar isotope data in the most informative way is presented in Fig. 2a-c. It pertains to an artificial binary mixture. The mixture was described and analyzed by Villa et al. (1996). A Cambrian age hornblende, MMwr, was mixed with a Miocene microcline, GA-1 (which had been dated by Villa, 1990). It should be stressed beforehand that to first order the mixture was binary, as it only consisted of two major phases.
- Ar isotope systematics of a mineral mixture. (a) Ca/K vs Cl/K common-denominator diagram (redrawn from the data of Villa et al., 1996). Red open circle, MMwr. Green open circle, GA-1. Black circles, individual heating steps of the artificial mixture. Blue open square, total gas, i.e. the sum of all steps. Redrawn from the data of Villa et al. (1996). The small pink square near the origin will be examined in closer detail in panel (e). (b) Age vs. Ca/K common-denominator diagram (redrawn from the data of Villa et al., 1996). Symbols as in panel (a). Note that the age values on the ordinate axis are not evenly spaced, as age is not a linear function of the 40Ar*/39Ar ratio (the true common-denominator ordinate). (c) Age vs. Cl/K common-denominator diagram (redrawn from the data of Villa et al., 1996). Symbols as in panel (a). The main trend is linear, as in panels (a) and (b), as the mixture consists of just two major phases. The small deviations are explained by the actual mineralogical composition of MMwr and GA-1. (d) Age spectrum (redrawn from the data of Villa et al., 1996). Green dash-dotted line, age of GA-1 (~18 Ma); red dashed line, age of MMwr (~520 Ma,); dotted blue line, “total gas age”, which has no geological meaning. (e) Detail of the GA-1 end-member (redrawn from the data of Villa, 1990), enclosed in the pink square in panel (a). About half of the Ar was released in one step, marked by a green filled triangle, which probably corresponds to K-feldspar least contaminated by retrograde phases. Other steps deviate both towards high Ca and towards high Cl. Subsequent studies (e.g. Chafe et al., 2014) have documented that “pure” microclines ubiquitously contain retrograde sericite and often contain relict plagioclase and/or also late-stage hydrothermal adularia, as confirmed by the divergent trends of GA-1 points degassed at different furnace temperatures.
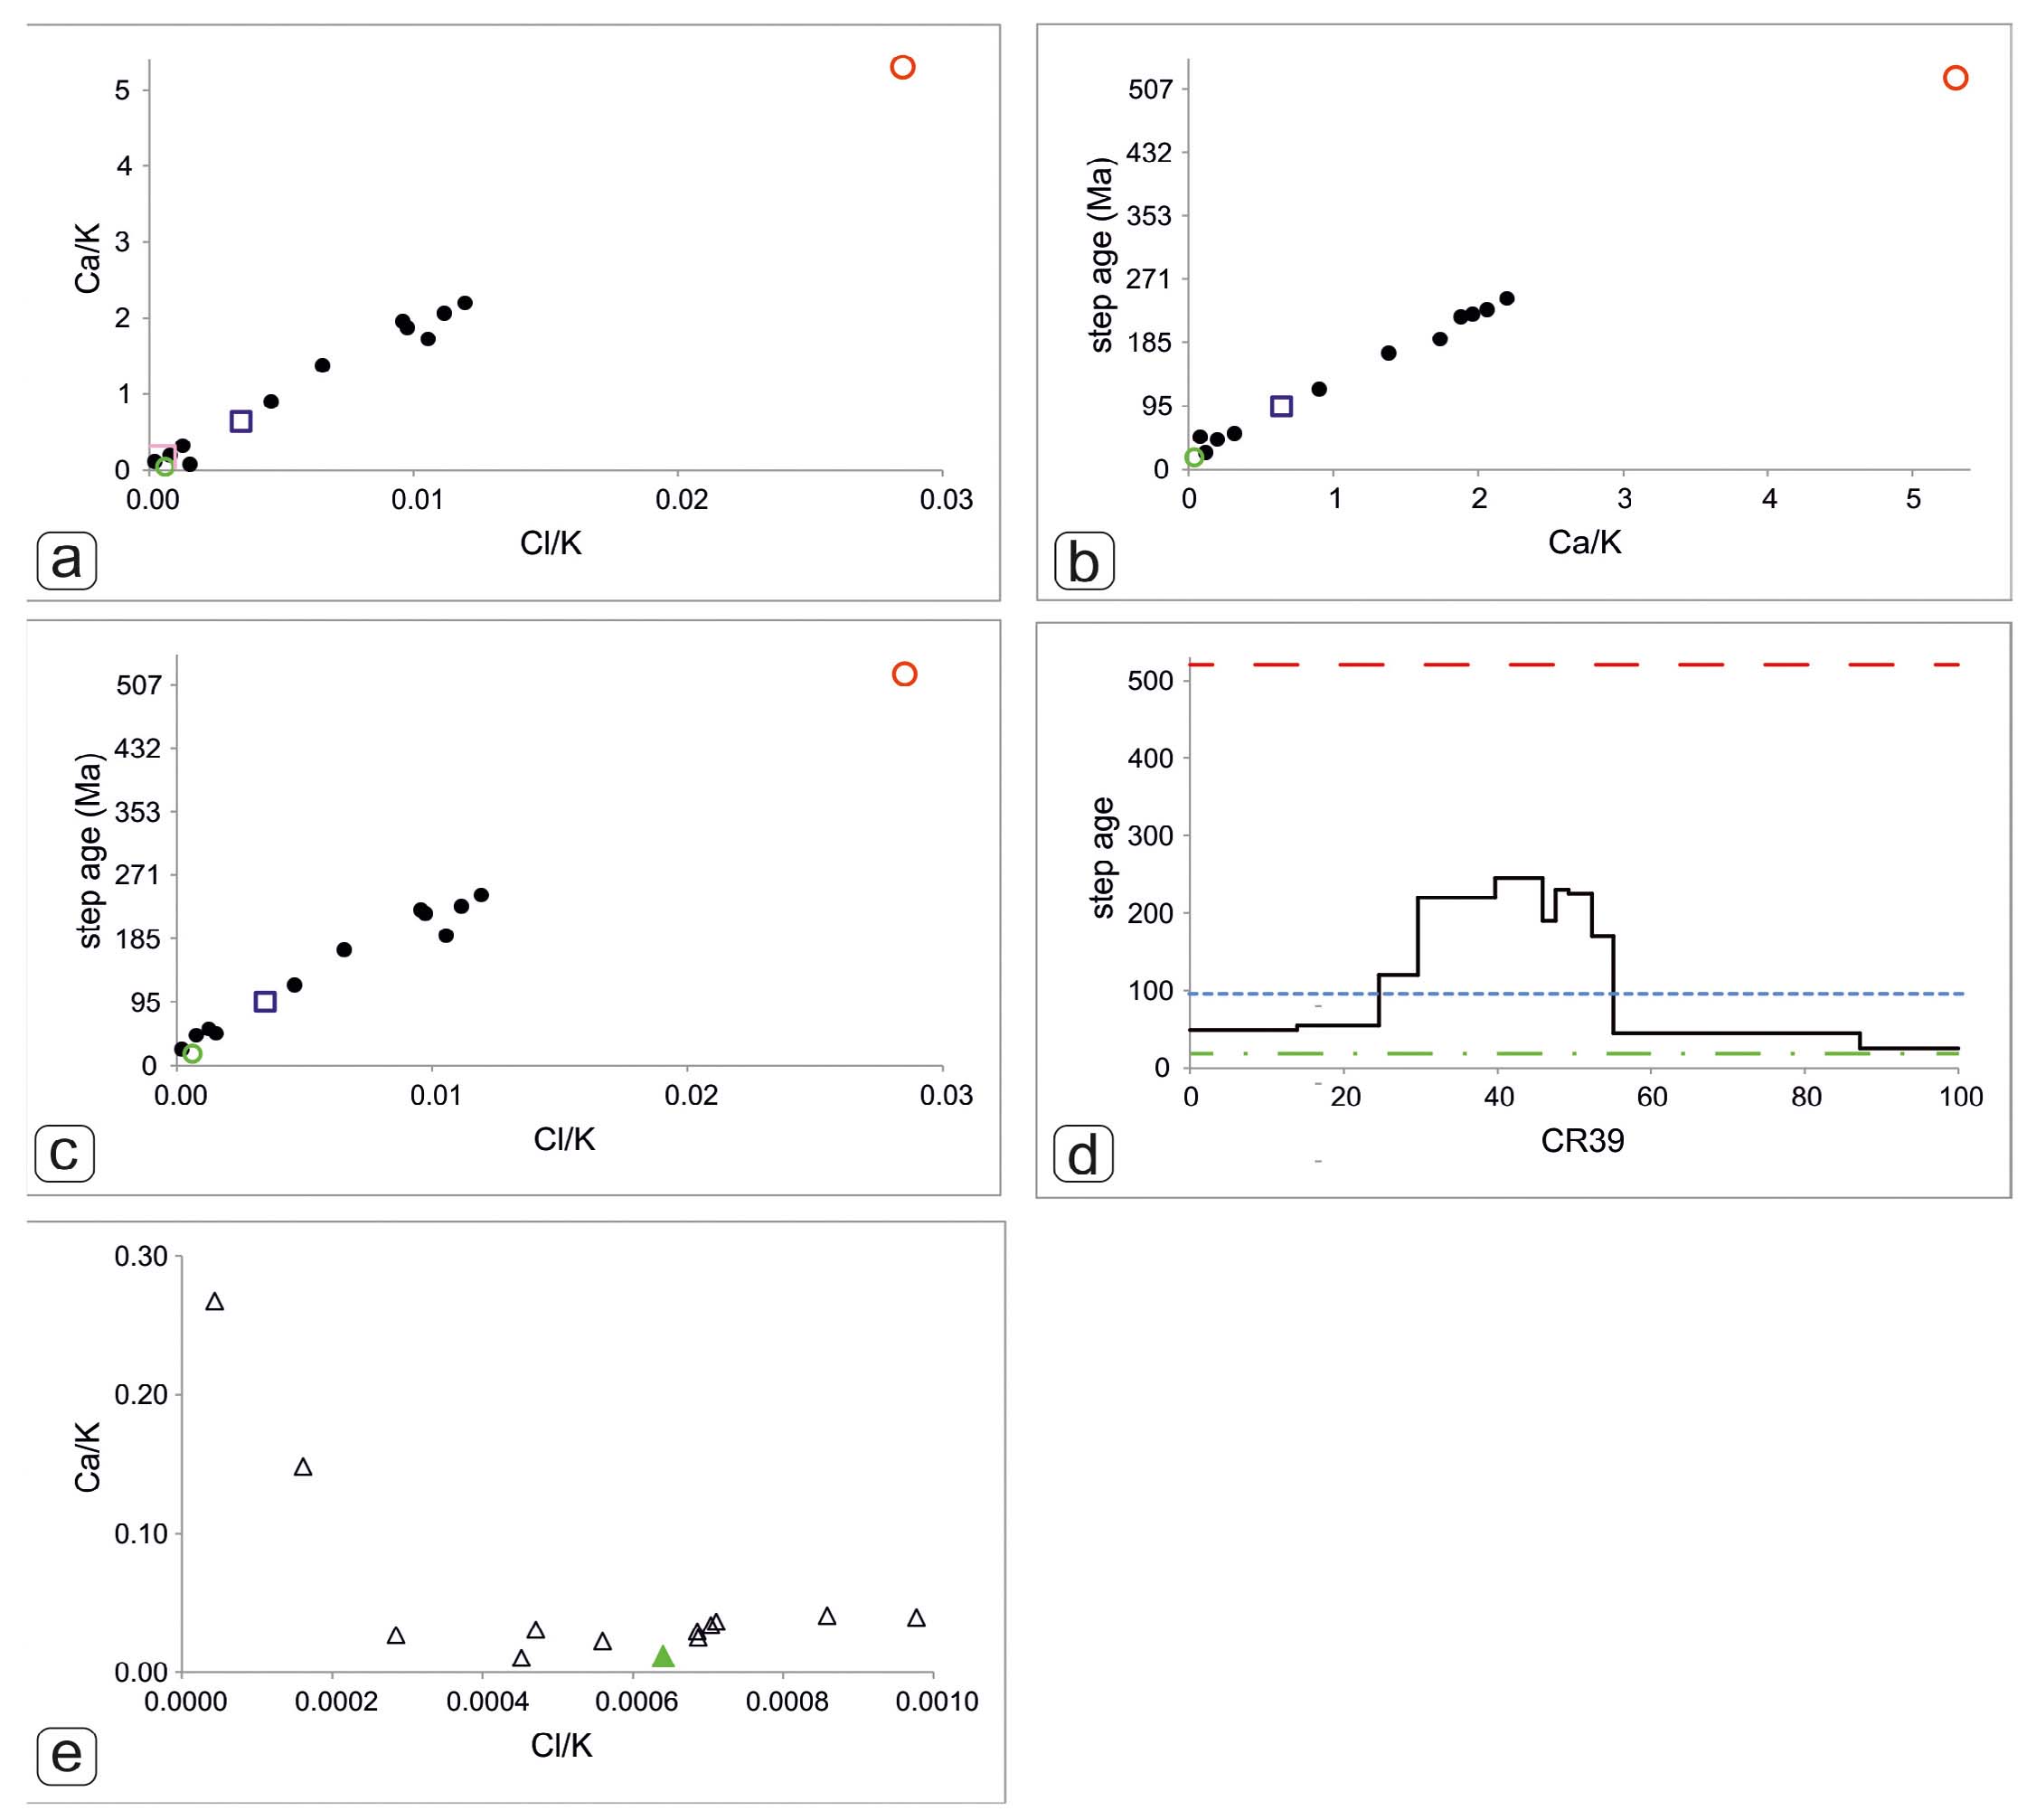
The diagram shown first, the Ca/K vs. Cl/K common-denominator diagram (Fig. 2a), constrains the number of phases in the mixture, and therefore sets the baseline for all subsequent interpretations. For algebraic reasons, only in common-denominator diagrams the points representing variable mass fractions of a binary mixture define a straight line correlation (Villa, 2001). Points that deviate from the linear correlation trend require additional end-member(s), as detailed by Villa (2001, his Fig. 2). In the studied mixture, the predicted linear correlation is indeed observed. However, small deviations from linearity are also visible. They must not be discounted as “unreliable analyses”, as in fact they have a solid mineralogical basis. In the age vs. Ca/K common-denominator diagram (Fig. 2b) the linear trend predicted for the binary mixture is again observed, as is the case for the age vs. Cl/K common-denominator diagram (Fig. 2c). In both of these diagrams the true end-member age of MMwr is not evident, but it can be easily calculated by extrapolating the linear correlation trend up to the Ca/K and Cl/K directly measured by EPMA. All three these diagrams show small deviations from strict linearity, as in panel (a). However, these small deviations plot in different directions in the three panels. This is explained by the actual mineralogical composition of MMwr as documented by Villa et al. (1996): the hornblende contains both small amounts of biotite and even retrograde alteration clays. The mineralogical composition of GA-1 was not addressed by Villa (1990); in hindsight, the leucogranite complex from which it was separated had disturbed Sr and Ar isotope systematics (Villa, 1990) and the petrological heterogeneity of the microcline is visible from Fig. 2e. The age spectrum (Fig. 2d) provides no additional information relative to the three common-demominator diagrams just discussed, and can actually be misleading, as the correct age of the two end-member minerals of the mixture (~18 Ma and ~520 Ma) cannot be reconstructed from the age spectrum, unlike panels (b-c). It is noteworthy that the “total gas age” of a mixture is completely devoid of geological significance (cf. Villa & Hanchar, 2017). A close-up of the Ar systematics of microcline GA-1 (pink square near the origin of Fig. 2a) is shown in Fig. 2e. About half of the 39Ar was released in one step, marked by a green triangle, which probably corresponds to K-feldspar least contaminated by retrograde phases. Other steps deviate both towards high Ca and towards high Cl. Subsequent studies (e.g., Chafe et al., 2014) have documented that “pure” microclines ubiquitously contain retrograde sericite and often contain relict plagioclase and/or also late-stage hydrothermal adularia, as confirmed by the divergent trends of points degassed at different furnace temperatures. It can safely concluded that the Miocene end-member of the artificial mixture is not represented by a single point in Figs. 2a-c but by the pink square containing the microcline, its Cl-rich late retrogression (sericite±adularia) and its Ca-rich relict inclusions (plagioclase).
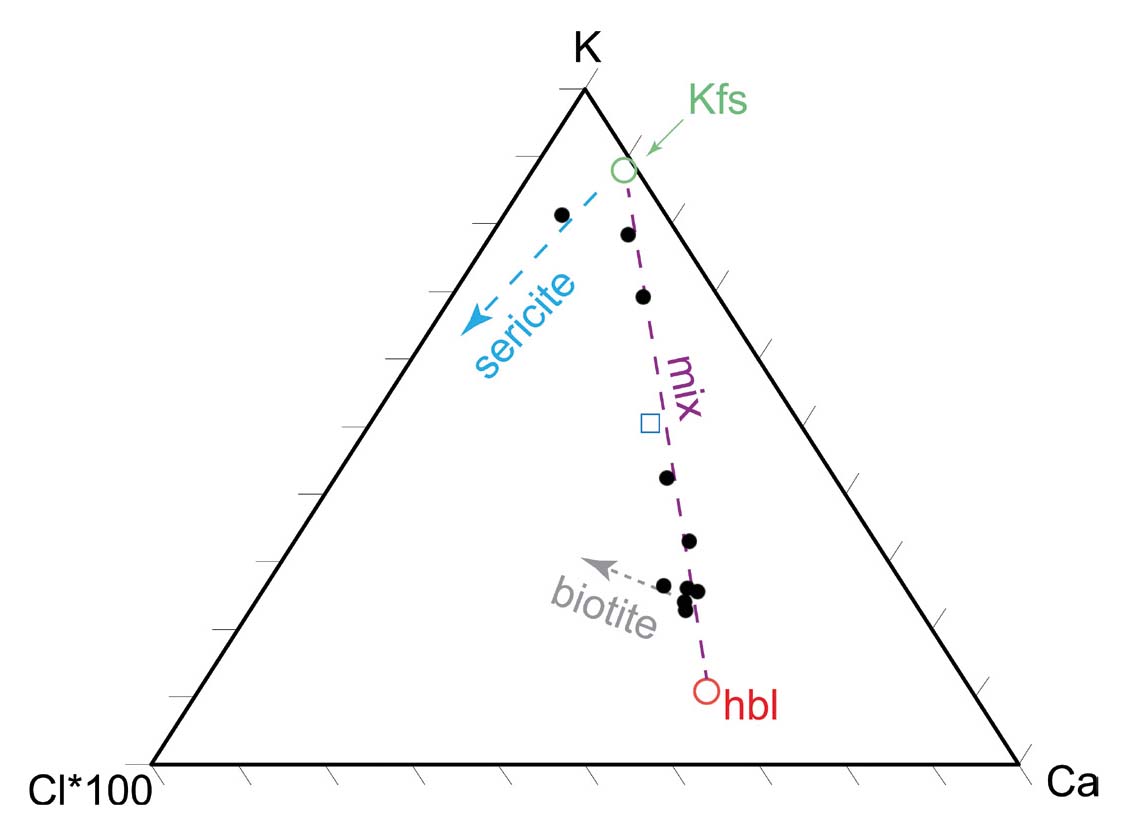
The Ar isotope data can also be plotted in an unconventional, “petrographic” triangle diagram (Fig. 3). In addition to the obvious mixing trend, this diagram displays two vectors pointing towards the left, which allow the identification of two subordinate phases recognised in the starting material: biotite intergrowths in the hornblende (documented by Villa et al., 1996), which points towards the upper left, as it is K-richer and Cl-poorer than hbl, and minor sericite alteration of the microcline, which points towards the lower left, as its stoichiometry is K-poorer than Kfs, whereas its Cl content is always quite high. This diagram visualises the information already displayed in Fig. 2, and adds the information on intergrown impurity phases based on the three ratios on the sides of the triangle: Ca/K, Cl/K and Ca/Cl.
- Triangle plot of the compositional constraints on mineral petrogenesis. The diagram has K, Ca and Cl at its vertices (the latter multiplied by 100, due to its low abundance in most minerals). Symbols as in Fig. 2a-c. The two vectors pointing towards the left identify two contaminant phases: biotite intergrowths in the hornblende, and sericite alteration of the microcline. This diagram is complementary to Fig. 2, as it helps fingerprint intergrown impurity phases.
In situ laser-ablation technique
The clear benefit of using a laser to extract argon is the possibility to perform in situ analyses on samples with complex microstructures or with suspected core-rim gradients or from polydeformed rocks recording successive generations of foliations. Laser-based argon extraction has been applied to extraterrestrial samples since the 1970s and terrestrial rocks since the 1980s; however, the near-IR lasers used initially produced a melt crater (Onstott et al., 1989) that sometimes led to two artefacts: not all of the melt ejecta might have been completely degassed; the mineral zones close to the melt crater might have been partially degassed as well. As a result, the effective spatial resolution was around 100 µm. The use of ultraviolet (UV) laser ablation directly vaporises the target, minimising the disturbance to the neighboring areas (Kelley et al., 1994), especially with the 193 nm wavelength excimer laser generation. This improved the spatial resolution between adjacent spot analyses and also allowed depth profiling. The instrumental setup was dubbed UV-LAMP (ultra-violet laser ablation microprobe) by Kelley et al. (1994). The shape of the vaporised area is usually a rectangle (Villa et al., 1996, their Fig. 5) produced when a ~1 µm diameter beam is rastered over a sufficiently large area to give a sufficiently large amount of Ar for a sufficiently precise analysis (the term “sufficiently” will be addressed below).
Significant applications of UV-laser ablation in 40Ar/39Ar dating include dating deformation events (e.g., Di Vincenzo et al., 2004, 2022), investigating argon transport mechanisms within minerals (e.g., Hodges et al., 1994; Villa et al., 1996; Hames & Cheney, 1997; Wartho et al., 1999), dating fault pseudotachylytes (Müller et al., 2002; Di Vincenzo et al., 2004) and impact-related pseudotachylytes (Spray et al., 1995), determining different stages of a P-T loop (Di Vincenzo et al., 2001). A unique advantage of in situ analyses by laser microprobe is the possibility of dating mineral inclusions in porphyroblasts (e.g., Kelley et al., 1997), which is not feasible by bulk rock crushing and conventional mineral separation. The development of laser extraction techniques has significantly expanded the applications of the 40Ar/39Ar method, aided by a new generation of multicollector mass spectrometers. The use of in situ laser techniques on well characterised portions of selected mineral grains is essential for correctly interpreting data, as it allows correlation between the isotopic record and microstructures. In situ analyses are commonly carried out on ~400 µm thick polished thick sections (Di Vincenzo et al., 2022; Montomoli et al., 2024).
A crucial issue with laser microprobe analyses is the size of the ablated mineral volume. In principle it is possible to focus a laser beam to an area < 1 µm2. Since single-pass UV laser pits are ~1 µm deep, with a single shot focused to 1 µm diameter the ablated sample mass is 3 pg. For a stoichiometric 30 Ma biotite the total released radiogenic 40Ar* is 700 atoms. This amount of gas is not sufficient for a precise analysis. Therefore, an area tens of µm wide must be repeatedly rastered to produce a pit tens of µm deep. The limiting factor for precision is the 40Ar* concentration, but on top of that there is the issue of accuracy. As metamorphic micas usually consist of successive generations (pre-shearing relicts, syn-shearing foliation-forming micas, post-shearing static overgrowths, alteration phases) intergrown at the µm scale (e.g., Montemagni et al., 2019), an excessively large ablation pit will always sample all of these phases together and produce meaningless mixed ages (see also below). The best way to disentangle mixtures is via the Ca-Cl-K systematics mentioned above; this requires that 37Ar and 38Ar be measured with a precision of a few percent at worst. It is a paradox that the requirement for accurate and precise laser microprobe dating are contrasting. A precise apparent age requires ablating a large sample volume; an accurate age estimate requires avoiding a mixture of microtexturally distinct mineral generations, using a pit size smaller than the scale of the microstructures. This requirement was dubbed “Goldilocks zone” by Villa (2022), referring to a nursery tale cited by Kasting (2019).
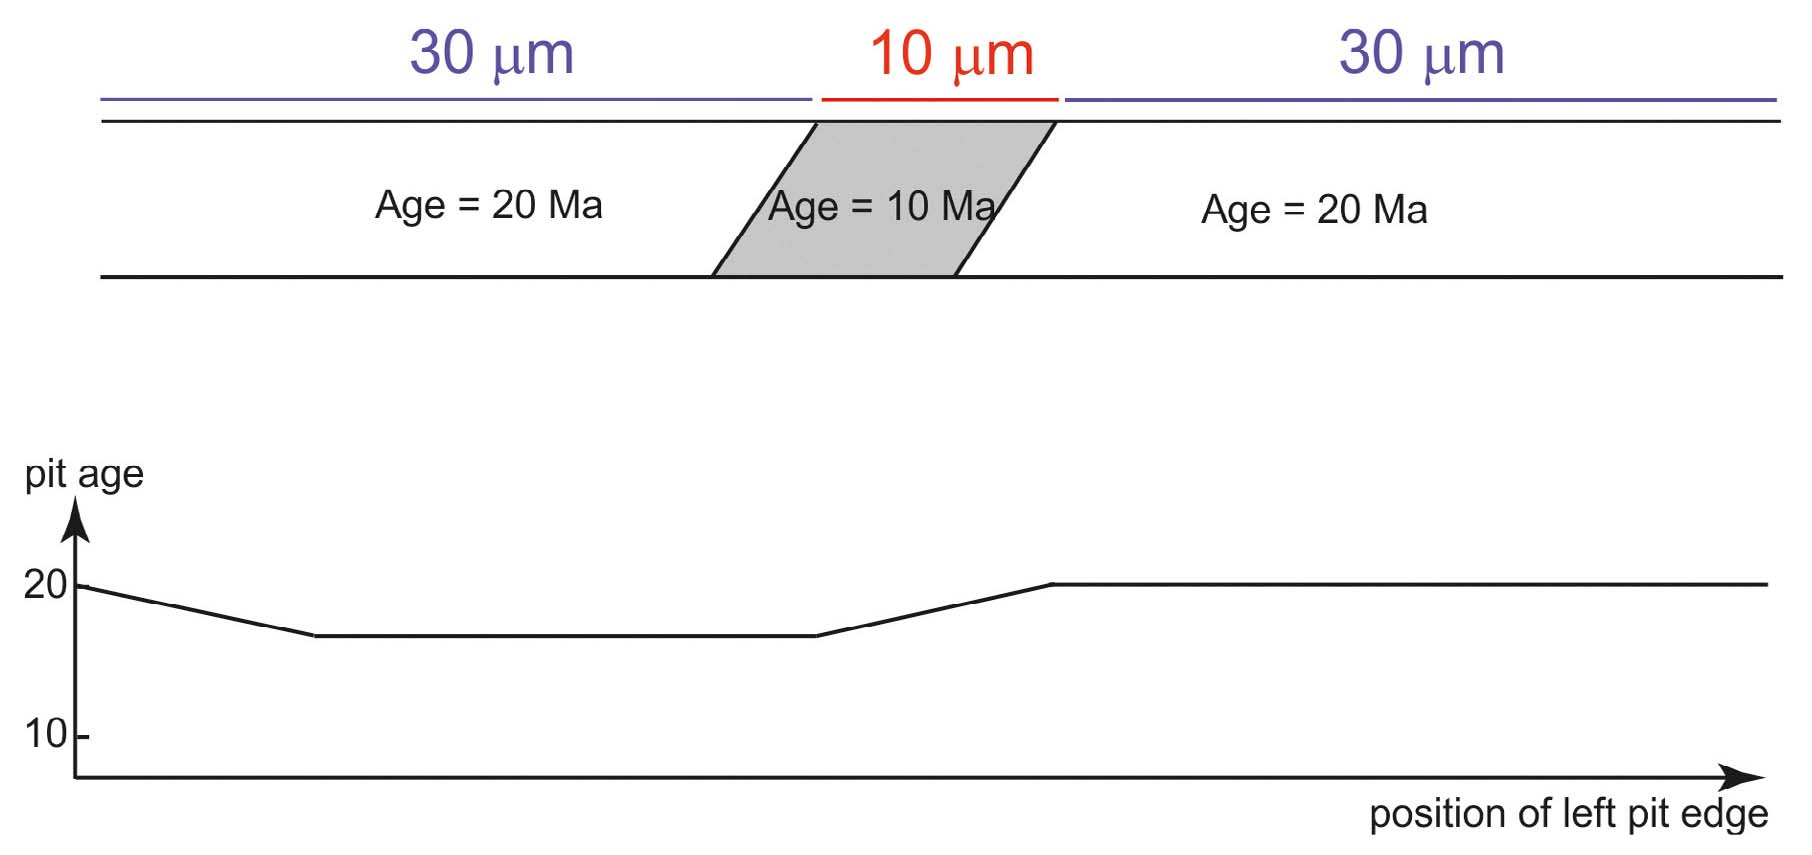
However, a possible workaround extending the “Goldilocks zone” towards revealing small intergrowths is sketched in Fig. 4.
- Schematic view of the effect of analyzing a microstructure smaller than the spatial resolution of the laser microprobe. The mineral in the upper part of the panel consists of a large 20 Ma old crystal (white) with a 10 Ma old, 10 µm wide intergrowth (grey). In this example the laser microprobe has a 30 µm spatial resolution. As long as the laser pits only ablate the white zone, a constant age of 20 Ma is obtained. By obtaining closely (< 1 µm) spaced laser pits across the intergrowth, progressively younger ages are obtained, whereby the minimum age remains constant at 16.66 Ma as long as the entire width of the intergrowth is within the laser pit. By moving the laser further towards the right, ages increase again up to the constant value of 20 Ma. It may appear that the 16.66 Ma minimum age does not provide a good estimate of the 10 Ma intergrowth age. However, by measuring the widths of the laser pit and of the intergrowth on an electron microprobe element map obtained on the exact location of the laser traverse it is possible to calculate the mass balance of the host mineral and the intergrowth. In this case, the mass ratio intergrowth:host ranges between 0 and 1:2, which by cross-multiplication translates to an intergrowth age of 10 Ma.
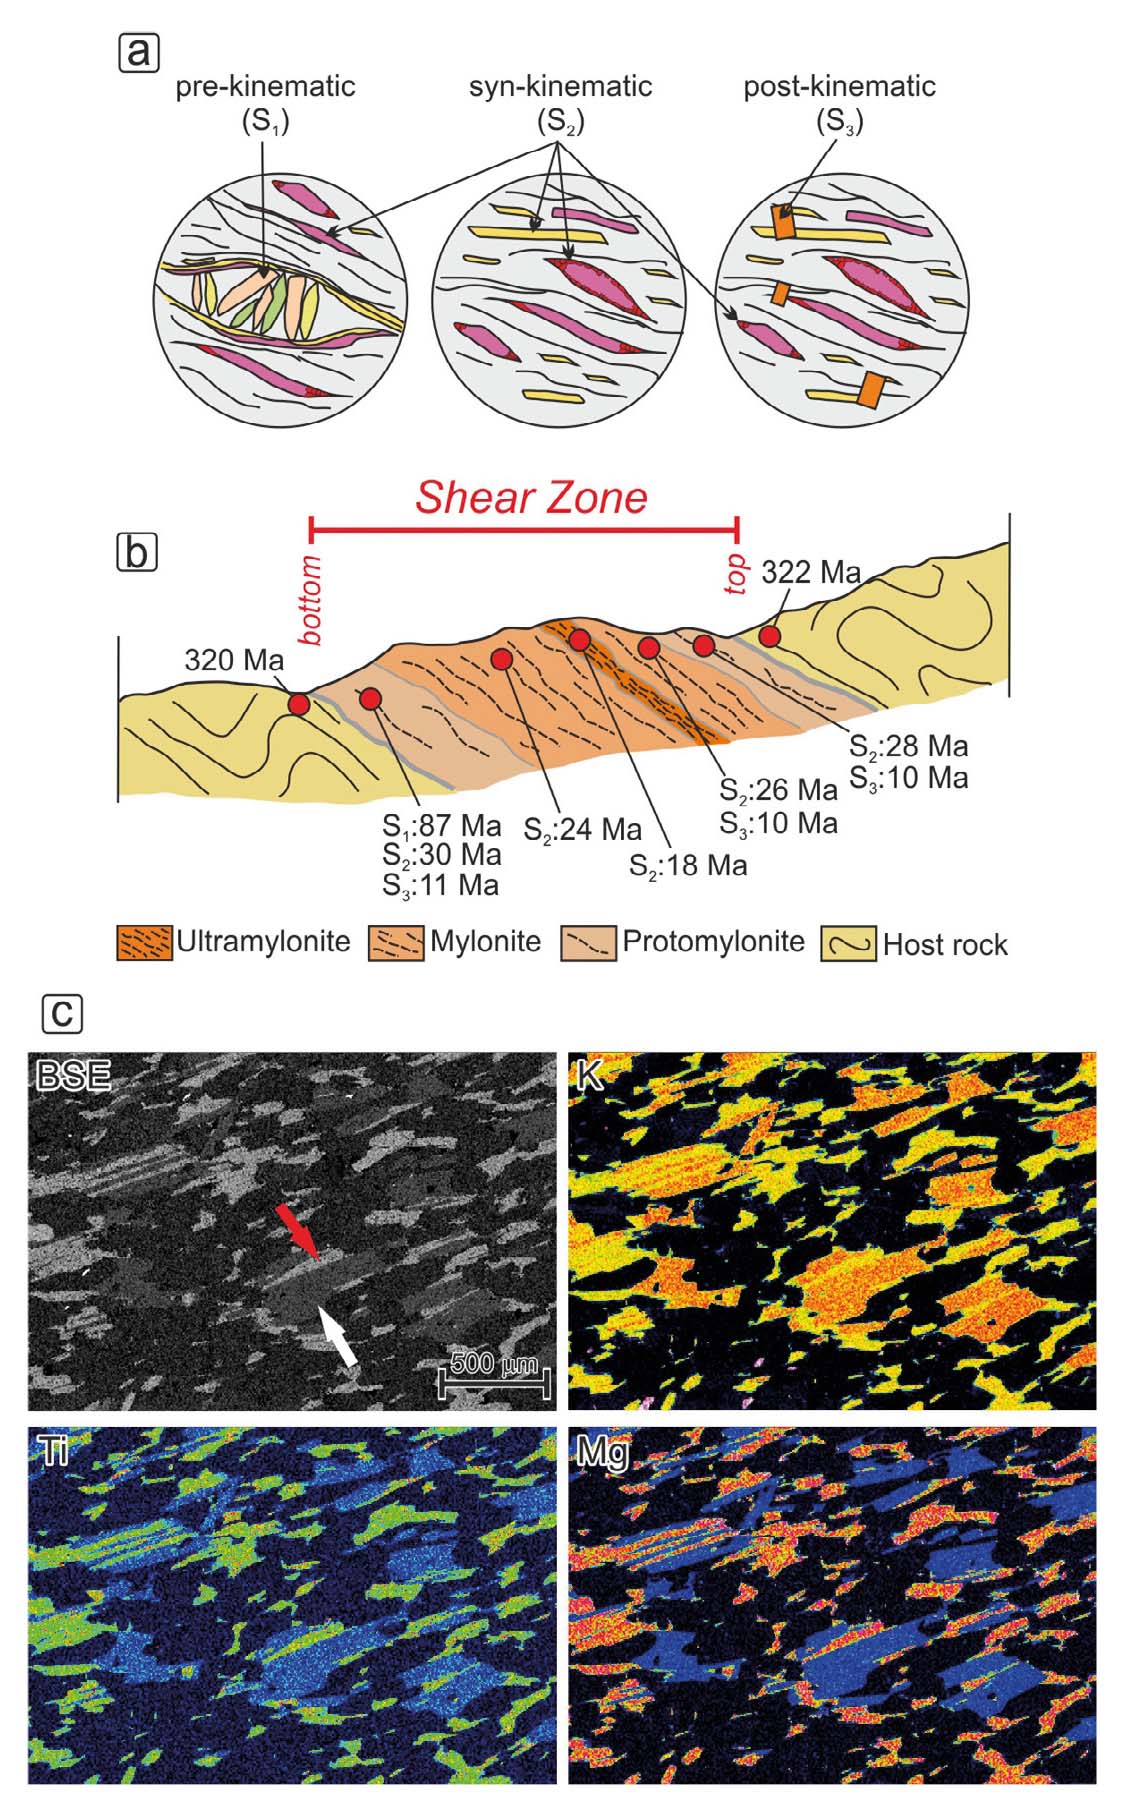
- (a) Sketch of different microtextural generations of micas recrystallised along different fabrics which could be preserved in shear zones-related rocks. Note that small grains recrystallised around mica fish or on their tails are strictly syn-kinematic. (b) Schematic cross section of a shear zone with development of protomylonites, mylonites and ultramylonites (Sibson, 1977). Red dots indicate samples with ages for different generations of mica recognised in the sample. Note that not in all sample all the generations are preserved. The ages have a younging direction towards the centre of the shear zone therefore having an evolution as type 2 shear zone (e.g., Fossen, 2016). (c) Back-scattered electron (BSE) images and element maps for K, Ti and Mg of a biotite-muscovite bearing quartzite which is the host rock of the Bhagirathi granite in Garhwal Himalaya (Searle et al., 1993) with a main foliation formed by crystallisation of biotite (red arrow) and muscovite (white arrow).
The concept of isotopic closure
It is qualitatively conceivable that friction heating of a fault or shear zone could contribute to the loss of radiogenic 40Ar from micas in a shear zone. In the following it is useful to review quantitatively how likely this hypothesis is.
The retentive properties of radiogenic isotopes in minerals have been misunderstood and oversimplified by several workers. The original confusion dates back to the 1950s, when the incomplete retention of radiogenic isotopes in a mineral geochronometer was generically attributed to “diffusion” (e.g., Tilton, 1960) without specifying the fundamental difference between rock matrix diffusion (Neretnieks, 1980) and diffusion in aqueous solution (Fick, 1855). Fick’s Law is on a conceptual par with Snell’s Law (what petrographer would accept the law that birefringence is nonexistent?) and Hooke’s Law (what seismologist would abide to purely elastic behavior of rocks under stress?). When Fick’s original formulation, valid for unimpeded transport of biological nutrients in a homogeneous aqueous matrix, is exported to solid crystal lattices, atomistic considerations had best be taken into account (e.g., Lasaga, 1981; Panzarini & Colombo, 1994). Especially quantum-mechanical phenomena (such as phonon rearrangement of the periodic structure of crystals at the atomic level) are unaccounted for in the mathematical requirement of an immutable, homogeneous matrix described by classical continuum physics. Unfortunately, theoretical calculations that attempt to quantify the movement of atoms in a crystal based on rigorous physics are exceedingly complex, and only very few have been published so far on the complex crystal structures typical of geological materials (e.g., Gautheron et al., 2020; Nteme et al., 2022). Therefore, the estimates of the retentivity of radiogenic isotopes in minerals has traditionally been addressed by two empirical approaches: laboratory experiments and field-based estimates. Laboratory experiments are necessarily performed in runs no longer than a few weeks, therefore requiring high temperature, whose results in turn require an extrapolation to mid-to-lower crustal conditions. For anhydrous minerals, the experimental design is comparatively simple (Cherniak & Watson, 2001; Cherniak et al., 2004) and leads to extremely low diffusion rates for Pb in zircon and monazite. These two minerals demonstrate systematic properties of isotope retention which will be discussed below, and negate Tilton’s (1960) interpretation by many orders of magnitude. Another anhydrous mineral geochronometer, K-feldspar, illustrates the dichotomy between wishful thinking and experimental evidence. Firstly, it is not useless to select gem-quality samples for laboratory experiments. As the overwhelming majority of terrestrial feldspars is altered to some extent (Goldich, 1938; Parsons & Lee, 2009), it is almost obvious that the Ar retention of feldspar must never be inferred from the analysis of clays (Chafe et al., 2014). Even the least altered terrestrial K-feldspar, the low sanidine from Itrongay, Madagascar, shows some aqueous alteration (Popov & Spikings, 2020), which means that Ar transport rates inferred from it do not accurately reflect those of ideal feldspar (Popov & Spikings, 2020). An even more fundamental impediment to a downslope extrapolation of Ar loss rates obtained at high temperature to geologically relevant crustal temperatures is the fact that the crystal structure at 800-900 °C is not the same as that at 300-400 °C (Kung & Villa, 2021).
Laboratory experiments on hydrous minerals, such as micas, have been demonstrated to be a failure for over half a century. Hofmann & Giletti (1970) unambiguously stated and proved that three different artefacts in their well-documented experiments of Rb and Sr transport in muscovite were due to dissolution-reprecipitation of muscovite in the capsule. The necessity to add water to the muscovite before the high-temperature run is necessary to avoid muscovite breakdown, but at the same time guarantees dissolution and associated reprecipitation as the water-muscovite solution becomes oversaturated. The reason for this unpleasant effect became clear a decade later, when Wood & Walther (1983) and Cole et al. (1983) independently quantified the dissolution rate of silicates. As discussed by Villa & Hanchar (2017) dissolution is several orders of magnitude faster than volume diffusion, all the way from geologically relevant temperatures (300 °C) to typical temperatures of hydrothermal laboratory experiments (700 °C). The subsequent experimental attempt by Hess et al. (1986) independently confirmed the findings of both Hofmann & Giletti (1970) and of the two dissolution rate papers (Cole et al., 1983; Wood & Walther, 1983) that the observed nm-scale alterations due to fast dissolution rates prevent the determination of the volume diffusion rate. Villa (2021) re-examined the complete data-set of the muscovite experiment by Célérier (2007), which confirms that the alleged diffusivity measurements were in fact dissolution rate measurements, with associated precipitation of new phases after massive breakdown reactions in the capsule.
In contrast, atomistic simulations by Nteme et al. (2022) obtained diffusion parameters yielding closure temperatures near the upper stability limit of muscovite, ranging from 560 to 800 °C, depending on cooling rates (1 to 100 °C/Ma) and grain sizes (0.1 to 1.0 mm).
Supporting this calculation, several field-based studies show that those white mica samples that had avoided significant recrystallisation preserve Ar isotope inheritance even when reheated to temperatures of 550-580 °C (Hammerschmidt & Frank, 1991; Hames & Cheney, 1997; Di Vincenzo et al., 2004; Heri et al., 2014; Villa et al., 2014). This aligns with observations that intergranular cation diffusion in white mica is negligible below ~550°C (Dempster, 1992). Since transport of major, structure-forming cations is what controls the mobility of radiogenic Ar (Villa, 1998), all the abovementioned field-based estimates of Ar mobility and of major element mobility converge to a coherent picture that agrees with the theoretical calculation by Nteme et al. (2022).
Petrologists have long proposed that the reequilibration of white mica in low- to medium-grade metamorphic rocks typically occurs through dissolution-reprecipitation reactions (Putnis, 2009, and references therein) at the nanometric scale (Hochella, 2002). Processes triggered by superimposed tectono-metamorphic events create complex submillimeter-scale textural and chemical heterogeneities due to incomplete equilibration (Airaghi, et al., 2017; Beaudoin et al., 2020; Akker et al., 2021; McAleer et al., 2021; Montemagni & Villa, 2021; Villa et al., 2023).
A legacy laser microprobe experiment by Wijbrans et al. (1990) on the blueschist-to-greenschist retrogression in the Attico-Cycladic HP province illustrates the sources of incorrect interpretation, which only were clarified in later decades. These authors observed scattered ages, which they sought to interpret by a strict diffusionistic approach. In the same Attico-Cycladic HP province, Villa et al. (2023) combined high-resolution backscattered electron (BSE) images with Rb-Sr and 40Ar/39Ar multichronometry and observed phengite-muscovite mixtures intergrown at the 5 µm scale, which they were able to disentangle using the Ca-Cl-K systematics described above. The < 10 µm scale of retrograde muscovite intergrowths is not exceptional (e.g., Federico et al., 2005) and is probably a ubiquitous feature of HP retrogression worldwide. Wijbrans et al. (1990) did not have BSE maps and they confused the material “single grain” with the property “monomineralic”. Their “single grains” were > 400 µm large and were certainly not monomineralic.
The internal age zoning of a single, large crystal of phlogopite was mapped by Phillips & Onstott (1988) by IR laser microprobe. The result was not compatible with a bell-shaped diffusion profile. The mathematical solution of Fick’s diffusion equations is the so-called error function, or erf(x), from which the observed age gradient grossly deviates (Phillips & Onstott, 1988, their Fig. 5). Their results have two often neglected implications. First, diffusion obeying the mathematical erf(x) is likely to be overrun by the much faster dissolution/reprecipitation (e.g., Bosse & Villa, 2019). Second, “single grains” rarely have a single petrogenesis and are polygenetic instead, if not downright polymineralic. The stepwise heating of the phlogopite studied in detail by Phillips & Onstott (1988) yields geologically misleading apparent ages, by the authors’ own statement.
A reduction of fault dating to a pure matter of cooling ages was attempted by Oriolo et al. (2018) using orthodox “thermochronology”, but the authors themselves were forced to admit that it provides internally inconsistent results. Instead, the petrochronological observations linking mineral microstructures and µm-scale compositional data demonstrate that recrystallization is ubiquitous due to dissolution-reprecipitation by aqueous fluids. As mentioned above, it has been known for 40 years that since dissolution at 400 °C is > 6 orders of magnitude faster than volume diffusion, the observed major element variations due to open-system mass transfer require that Ar loss caused by aqueous fluid circulation along and near the fault have overwhelmed and overrun any possible diffusive loss below 550 °C.
MICROSTRUCTURAL AND PETROCHEMICAL ANALYSES
The microscale characterisation of fabric and minerals plays a crucial role in accurately dating deformation events recorded in shear zones-related rocks, whatever is the applied geochronometer. Addressing the challenges posed by different generations of mineral recrystallised along different fabrics (Fig. 5a) requires careful integration of dating methods with petrographic and chemical analysis (e.g., Challandes et al., 2003; Sanchez et al., 2011; Montemagni & Villa, 2021; Di Vincenzo et al., 2022; Giuntoli et al., 2024; Simonetti et al., 2024). Indeed, in polydeformed metamorphic rocks, achieving accurate age determinations requires careful sample selection, along with detailed petrological, microstructural, and microchemical characterisation to distinguish the (re)crystallisation of different mineral generations (Airaghi et al., 2017; Montemagni et al., 2019; Montemagni & Villa, 2021; Giuntoli et al., 2024).
The conditio sine qua non for any subsequent interpretation is a detailed structural geological fieldwork (e.g., Rolland et al., 2009; Zanchetta et al., 2011; Zanchi et al., 2021; Montemagni & Zanchetta, 2022; Montomoli et al., 2024), aimed also at drafting a detailed geological map of the study area, and the sampling for subsequent laboratory analysis. Sampling strategy in the field is fundamental: different transects along and across strike of the studied shear zone have to be planned and analysed (Montemagni et al., 2023) to guarantee internal consistency and to reveal the geological-petrological causes of inconsistent outliers (Fig. 5b).
A note of caution is that detailed field work alone is not sufficient for reliable interpretations if the petrologic-microtextural-microchemical context is ignored in favor of an interpretive scheme based on incorrect “diffusivity” assumptions (e.g., Hueck et al., 2020).
In any case, it is necessary to select samples suitable for dating only based on a detailed microstructural and petrographic study, so as to identify different generations of minerals, as well as a microchemical characterisation by EPMA acquiring spot analyses and X-ray maps to quantify the scale and the extent of any compositional variations in the minerals to be dated (Fig. 5c).
Di Vincenzo et al.(2022) highlight how compositional variations at the (sub-)mm scale correspond to 40Ar/39Ar age variations. Similarly, Airaghi et al. (2018), Montemagni & Villa (2021), and Villa et al. (2023) demonstrated that retrogressed micas may exhibit submicron-scale zoning, which requires extensive mapping to distinguish between different generations of mica (including incompletely rejuvenated relicts). The intra-grain age-compositional correlations significantly affect the interpretation of ages: even assuming, purely for the argument’s sake, that the oldest generation within a chronologically heterogeneous grain gives a “cooling age”, all younger ages within the same grain are necessarily recrystallisation ages. If one were to analyze this grain with a spatial resolution insufficient to resolve the individual patches one would obtain a meaningless mixed age. A tectonic reconstruction based on interpreting the bulk age of such a grain would be just as meaningless. The same caution must always be applied when inferring erosion histories from grains contained within a sediment: in the absence of a careful documentation of each grain’s internal compositional and chronological zoning, and of the petrogenetic context of the analyzed mineral with the rest of its original assemblage, the inferred conclusions are entirely arbitrary.
In poly deformed rocks where mineral intergrowths are pervasive (Montemagni & Villa, 2021), the ability to discriminate between pristine and altered phases is essential to avoid misinterpretation of ages. Here, EPMA maps combined with isotopic data provides key insights into the mineralogical and chemical factors that control the Ar release during furnace heating, reinforcing the value of high-resolution chemical and textural analysis (e.g., Lanari et al., 2019; Giuntoli et al., 2024).
DISCUSSION
Constraining shear zone structural evolution
Shear zones are key structures of strain localisation (Ramsay, 1980) in several tectonic settings; thus, determining the timing of shear zone activity is essential for understanding crustal deformation in orogens and in other tectonic settings. However, most shear zones underwent complex histories under different P-T conditions, often involving strain partitioning and localisation (e.g., Sanchez et al., 2011; Fossen & Cavalcante, 2017; Simonetti et al., 2021 and references therein).
The evolution of shear zones is governed by several factors, including the deformation regime, the kinematics of the flow, temperature, strain rate and magnitude, and the rheological properties of the involved rocks. Models addressing the variability in shear zone evolution and strain localisation include both strain-hardening and strain-softening processes (Hull, 1988; Means, 1995). Strain softening processes (i.e., grain size reduction, (re)crystallisation of weaker minerals, introduction of fluids, increase in temperature; Platt & Behr, 2011; Fossen, 2016) may progressively localise deformation within the core of the shear zone, leading to a constant shear zone thickness with increasing strain. Conversely, strain hardening processes (tangled dislocations making it harder to accumulate strain, Fossen, 2016) can cause deformation to migrate into the wall rocks, thereby widening the shear zone. The thickness of a shear zone is thus largely affected by accumulated strain and rock rheology during deformation (Fossen & Cavalcante, 2017 and references therein). Analyzing the structural evolution of ductile shear zones is further complicated by metamorphic processes that often occur during deformation. In particular, detailed examination of the margins and the core of shear zones is necessary to determine the activity of each part over time, contributing to understand whether shear zones thicken or thin as they evolve (Rolland et al., 2009; Fossen & Cavalcante, 2017; Simonetti et al., 2021; Montemagni et al., 2023). Additionally, fluid infiltration, governed by shear zone permeability during deformation, promotes dissolution–reprecipitation, which influences both deformation mechanisms and isotope exchange. This complicates interpretation of geochronologic data, making an integration of structural analysis and geochronology mandatory for understanding shear zone evolution over time. Thus, especially in the case of poly-deformed and sheared rocks, the powerful bond between structural geology and geochronology/petrochronology appears clearly. It is essential to understand the relationship between deformation, metamorphism and associated fluid circulation in shear zones, for accurate geochronologic interpretations (Villa, 1998; Williams & Jercinovic, 2012; Ceccato et al., 2024). Thus, to constrain reliable P-T-a-X-ε-t (pressure–temperature–water activity–composition–strain–time) paths in shear zones, geochronologic data must always be integrated with independent P–T estimates and microtextural-microchemical data on closed-system mineral deformation mechanisms and/or open-system retrograde reactions during the associated deformation.
Reconstructing a detailed shear zone deformation history therefore requires integrating petrochronologic data of pre, syn, and post-kinematic minerals in sheared rocks (Fig. 5a) with additional geochronologic constraints on protolith ages and wall rocks (Fig. 5b). Larger-scale interpretations are robust when supported by the analysis of µm-scale textures and when the information provided by microtextures (Fig. 5a,b) is correctly understood.
Thus an integrated, multiscale and multidisciplinary approach, involving field based geological and structural observations, microtextural and chemical analyses, X-ray elemental mapping and multichronometric geochronology, is recommended to reliably assess the long-lasting evolution of crustal-scale shear zones. The sampling strategy should be “redundant”, aiming for internal consistency checks; this requires a higher workload in the laboratory but is necessary for a robust quantification.
Stepwise Release and Spatial Resolution: the advantages of complementarity
In situ laser-ablation technique allows the direct analysis of specific mineral phases in their textural context with other phases. This method is particularly advantageous for exploring complex microstructures, where different generations of minerals may coexist within a single sample (Fig. 5a,c), provided it is possible to avoid mixing of different generations. Depending on the size of the microtextures to be analyzed, laser probes can analyze multiple generations of the same mineral within one thin section, obtain traverses across minerals, and analyze minerals too small to be separated or that are included in other minerals. Laser probes can obtain ages on spots ~20-30 µm in diameter. Their limiting factor is the instrumental sensitivity of the mass spectrometers, which confines in situ analyses to relatively old, Cl-rich and Ca-rich samples (the latter requirement is the a posteriori proof that only one mineral generation of the targeted mineral was actually analyzed).
The complementary analytical approach, step-heating, provides a detailed breakdown of the degassing behaviour of minerals across different temperature intervals. This allows to identify and separate the degassing peaks associated with different mineral generations or inclusions/intergrowths (such as e.g., chlorite, Cl-poor biotite, Cl-rich biotite, muscovite, phengite, feldspar, etc), making it a robust method for complex polydeformed rocks. Stepwise heating lacks the spatial resolution of in situ methods but compensates this deficit by offering the compositional fingerprint of minerals via a combination of EPMA element mapping with Ca–Cl–K systematics. This increases the comprehension of the petrogenetic history of the sample, particularly in rocks where mineral phases are too intimately intergrown to be separated physically.
Basically, when studying polydeformed rocks, first of all the petrological context must be addressed by microchemical-microtextural groundwork. Once the successive mineral generations are well understood at the (sub-)µm scale, the combination of in situ dating with stepwise heating can provide the most reliable and robust information, as the two complementary dating techniques optimise both precision and accuracy. Thus, it is important to stress that laser extraction and stepwise heating techniques are complementary and do not necessarily exclude each other: laser microprobe and stepwise heating experiments enable comparison of the different information provided by the two techniques, namely, spatially resolved analyses by the laser probe and differential gas release from chemically/mineralogically distinct phases by stepwise heating (Müller et al., 2002; Di Vincenzo et al., 2022; Montomoli et al., 2024). The combination of these techniques therefore offers a better understanding of the age and nature of deformation events.
FINAL REMARKS
The only way of reliably dating deformation requires a very labor-intensive workflow that combines an in-depth documentation of mineral microtextures and their compositional ranges, and the establishment of a context between the petrological constraints and geochronology. It becomes increasingly well-documented that individual grains of most samples, not only in mono- and polymetamorphic but also in magmatic, and therefore also in sedimentary, rocks ubiquitously contain different mineral generations: relict phases, index minerals formed at the metamorphic peak, retrograde mineral intergrowths formed during exhumation, and surficial alteration (mostly, but not only, affecting detrital grains in sediments). Each of these kinds of phases can consist of several, subtly different members of the same mineral family. Especially the quest for an accurate enumeration of the mineral generations in a suite of rocks should be given high priority.
Overdetermined data-sets are the key to controlling the internal consistency of the inferred geological evolution. Minerals from a suite of rocks that presumably underwent the same sequence of geological events ought to give the same reconstruction, whereas similar rocks from the same broad area that record a simpler or more complex evolution can shed light on what isotopic changes are linked to the changed history. To this end, multichronometry (U-Pb, Rb-Sr, 40Ar/39Ar) can provide the required constraints. The use of complementary 40Ar/39Ar analytical approaches can be equally useful, as laser microprobe dating can identify, date and provide Ca-Cl-K fingerprints of relicts at the 20 µm scale and by inference export these results to even smaller scales, whereas stepwise heating cannot resolve the subgrain microtextures but can use the compositional fingerprint provided by the laser microprobe results and associate them to the diathermal in vacuo Ar release caused by the differential breakdown of the different phases.
The choice of such complementary dating methods fulfills the essential requirement of approaching the ‘Goldilocks’ zone: being able of telling apart texturally small mineral generations that coexist inside single mineral grains. Despite the labor-intensive cost of these numerous analyses, the cost-benefit budget is favorable, as it is only the recognition of context that can provide an accurate and reliable understanding of the processes that control the chronological information hidden in deformed rocks.