
INTRODUCTION
Fossil footprints contain much information about dinosaur behaviour not available from their bones alone. Examples include gait (Thulborn, 1984; Lockley et al., 1994), locomotory speed (Alexander, 1976; Farlow, 1981; Thulborn, 1982; Navarro-Lorbés et al., 2021), and social structure (Cotton et al., 1998; Fiorillo et al., 2014; McCrea et al., 2014). However, associating tracks with their trackmakers is a key challenge for palaeoichnologists, because strata rich in body fossils rarely preserve tracks and vice versa. Several measurements (e.g., footprint proportions, stride and pace length) have been devised to describe track and trackway morphology. Among them, interdigital angle (IDA) has been used to its greatest advantage in tridactyl dinosaurs (Thulborn, 1990).
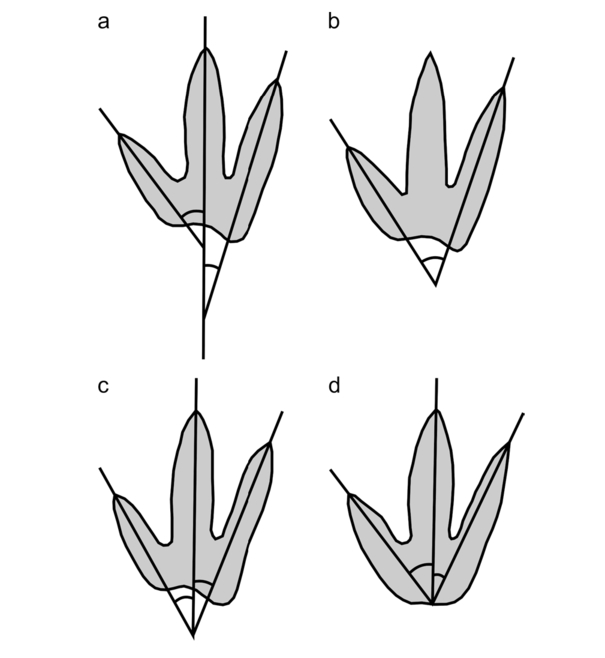
Interdigital angle is the angle formed by the impressions of the functional toes (in tridactyl dinosaurs, these are typically digits II–IV). Thus, one might measure the angle between digits II and III, III and IV, or II and IV (such angles are referred to here as, e.g., IDAII-IV). The angle between digits II and IV is often called total divarication angle (Thulborn, 1990). These angles can be measured in a variety of ways (Thulborn, 1990: fig. 4.5; Camens & Worthy, 2019: fig. 2; Fig. 1). However, the taxonomic utility of IDA has been questioned, and some have suggested that it is highly subject to the vicissitudes of growth, pathology, sexual dimorphism, trackmaker kinematics, and the mechanical properties of the host substrate (e.g., Thulborn, 1990; McCrea et al., 2015; Hornung et al., 2016). Perhaps so, but the question remains: Did the bony structure of the dinosaur’s foot have any influence on the splay of the toes as the animal walked along the ground? If this is the case, it would provide some a priori reason to think that IDA might be a valid means of discriminating between groups of dinosaurs in the ichnological record, apart from the aforementioned complicating factors.
- Measurement of interdigital angle (IDA) in dinosaur feet (modified from Thulborn, 1990: fig. 4.5). a) interdigital angles measured between lines of best fit; b) IDAII-IV (total divarication) measured between lines of best fit; c) interdigital angles measured on the assumption that all digital axes radiate from a common locus; d) interdigital angles measured on the assumption that all digital axes radiate from a common locus at the posterior margin of the footprint. In this study, IDA was measured as in a) and b).
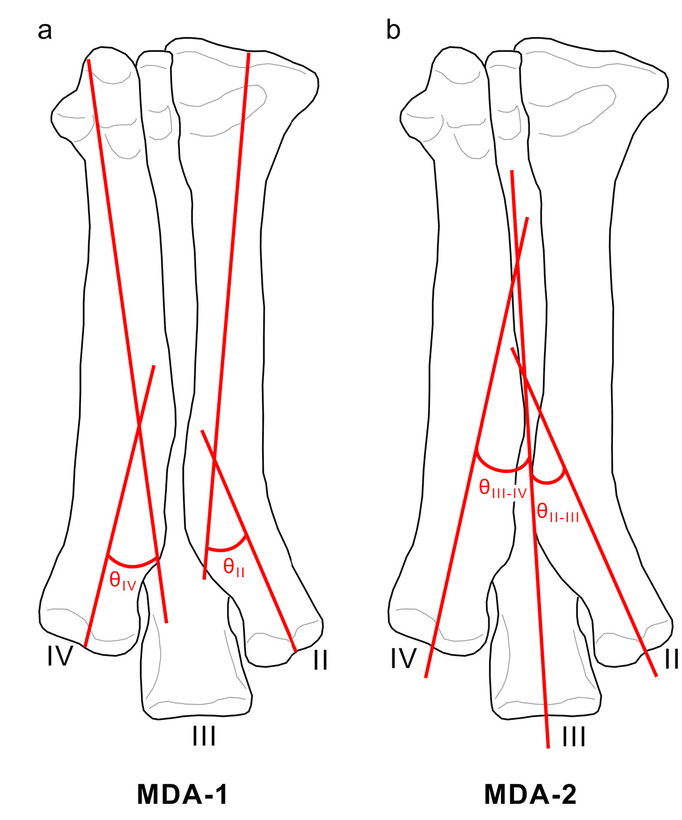
- Two methods for measuring metatarsal divarication angle (MDA) in tridactyl dinosaurs. a) In MDA-1, straight lines are fitted to the proximal and distal ends of metatarsals II and IV, and angles θII and θIV are measured at the points of intersection for each. b) In MDA-2, straight lines are fitted to the distal ends of metatarsals II-IV, and angles θII-Ш and θIII-IV are measured between metatarsals II-III and III-IV, respectively. For each method, the sum of the angles yields a measure of MDAII-IV. See text for further details.
The present study offers a careful look at dinosaur foot anatomy to determine its relation to IDA. It is divided into four main considerations: (1) How best to approximate toe splay in the foot skeleton; (2) how approximated toe splay relates to IDA (in both living and fossil taxa); (3) whether there is an allometric component (ontogenetic or phylogenetic) to approximated toe splay; and (4) whether approximated toe splay differs between groups of dinosaurs. We apply our findings to a Late Jurassic assemblage of tridactyl dinosaurs as a test of prior ideas concerning foot shape and habitat preferences.
Institutional abbreviations
AMNH, American Museum of Natural History, New York, New York, USA; CMN FV, Canadian Museum of Nature (Fossil Vertebrates), Ottawa, Ontario, Canada; MPC, Mongolian Paleontological Center, Ulaanbaatar, Mongolia; FMNH, Field Museum of Natural History, Chicago, Illinois, USA; IRNSB, Royal Belgian institute of Natural Sciences, Brussels, Belgium; IVPP, Institute of Vertebrate Paleontology and Paleoanthropology, Beijing, China; IWCMS, Dinosaur Isle, Sandown, UK; LH, Museo de las Ciencias de Castilla-La Mancha, Cuenca, Ecuador; MOR, Museum of the Rockies, Bozeman, Montana, USA; NHMUK, Natural History Museum, London, UK; PIN, Paleontological Institute, Russian Academy of Sciences, Moscow, Russia; ROM, Royal Ontario Museum, Toronto, Ontario, Canada; TLG, Todd L. Green Research Collection, Denver, Colorado, USA; TMP, Royal Tyrrell Museum of Palaeontology, Drumheller, Alberta, Canada; UAM, University of Arkansas Museum, Fayetteville, Arkansas, USA; YPM, Yale Peabody Museum, New Haven, Connecticut, USA.
MATERIALS AND METHODS
Approximating toe splay
To understand whether groups of dinosaurs differ in the splay of their toes, it is first necessary to devise some means of estimating their toe splay. Toe splay angle is difficult to measure in dinosaurs. For one, dinosaur toes, being made up of many small and light phalanges, are rarely completely preserved. For another, it is possible to articulate pedal phalanges in a variety of ways so that minuscule variations in their alignment amount to large deviations along the length of the toe. For these reasons, we focus here on the distal ends of the metatarsals, which are typically divergent and presumably constrained how the toes projected from the metatarsus. We acknowledge that unpreserved articular cartilage and connective tissues would have influenced the alignment of the toes in ways not entirely predictable from either the metatarsals or the toes themselves. However, unlike long bone cartilage, which was thick in dinosaurs and likely a poor reflection of the underlying bony articular surface (Bonnan et al., 2010), dinosaur phalangeal cartilage was thin and unlikely to have appreciably altered the articulation of the pedal phalanges.
It is possible to estimate toe splay in a variety of ways; indeed, an unpublished undergraduate thesis by senior author Davidson (2024) sought to determine which of four ways devised by us was most repeatable (i.e., had the lowest variance of repeated measurements). Of the four methods tested, the one that we designate here Metatarsal Divarication Angle 1 (MDA-1) was most repeatable. This approach consists of extending a line from the midpoint of each proximal and distal articular surface of metatarsals II and IV to visually fit the proximal and distal long axes of the respective metatarsal. The angle of intersection of these lines is measured for each metatarsal (Fig. 2a), and the angles are then added to give an estimate of MDAII-IV.
We also introduce MDA-2 (not considered previously by us), which consists of drawing straight lines through the long axes of the distal ends of the metatarsals and then measuring the angles formed by the intersection of the lines between metatarsals II-III and III-IV (Fig. 2b). As above, the sum of these angles provides an estimate of MDAII-IV. This method requires complete metatarsi (or at least metatarsals II–IV).
In this study, senior author Davidson measured MDA, using both methods, from digital photos taken either first-hand or from the literature. A single observer was used to reduce the effects of interobserver measurement error. We relied on photos of metatarsi (articulated, if possible) in anterior view. Straight lines were traced, and angles were measured, using the appropriate tools in ImageJ v. 1.54d (Abramoff et al., 2004). Where possible, MDA values represent the averages of left and right feet.
Taxon selection
Our study primarily focuses on tridactyl, bipedal dinosaurs. It should be noted that the earliest dinosaur pedes have relatively elongated first toes (e.g., Novas, 1994; Sereno et al., 2012) which may have been at least partially weight bearing. Precisely when these animals evolved a fully tridactyl condition is unknown (or, conversely, when some groups secondarily reverted to the tetradactyl condition). For this reason, we consider some possibly tetradactyl forms here, too (e.g., Herrerasaurus, Psittacosaurus, Saturnalia, oviraptorosaurs), in which the first toe of the hindfoot was well developed and may have contacted the ground while walking but probably did not bear an equal share of the body weight.
Similarly, functionally didactyl forms, wherein the second digit of the pes bears a raptorial claw that is held aloft, are known among paravians (e.g., Troodontidae, Dromaeosauridae, Archaeopteryx). Although these forms can be distinguished by their two-toed trackways (e.g., Kim et al., 2008; Ishigaki & Lockley, 2010; Lockley et al., 2016), we nevertheless included them here to examine the influence that the evolution of the hyperextendable second digit might have had on MDA.
Our dinosaur MDA dataset (Tab. S1 of Supplementary Materials 1) encompasses 153 individuals spanning mostly theropods and ornithischians (Fig. 3), represented in our graphs by rusty red and emerald green colours, respectively (blues are not associated with any particular taxon, unless otherwise noted). For many of the analyses described below, we sought groupings that maximised the competing virtues of both phylogenetic resolution and sample size. Thus, among theropods, these groups consist of Allosauroidea, Ceratosauria, Coelophysoidea (including Dilophosauridae, which we acknowledge is contentious), Ornithomimosauria, Oviraptorosauria, Paraves, and Tyrannosauroidea. Ornithischians are represented by Ornithopoda and a paraphyletic grouping of basal forms. We included relatively few large ornithopods (e.g., styracosternans) in our dataset because their footprints are typically easily distinguished by their wide toes and blunt claw marks (Thulborn, 1990), and their identification is thus uncontroversial; distinguishing theropods from ornithopods is more difficult at smaller body sizes (Farlow, 1987; Moratalla et al., 1988; Hurum et al., 2016; Farlow et al., 2018; Farlow et al., 2022). Nevertheless, some large ornithopods (including juvenile forms) were included for representation. Some taxa defy our categorisation scheme (Eoraptor, Herrerasaurus, Ornitholestes, Psittacosaurus, Saturnalia, Zuolong), because either their precise relationships are unknown or they fall outside the above groupings, but they are considered here insofar as they contribute to the more inclusive analyses described below.
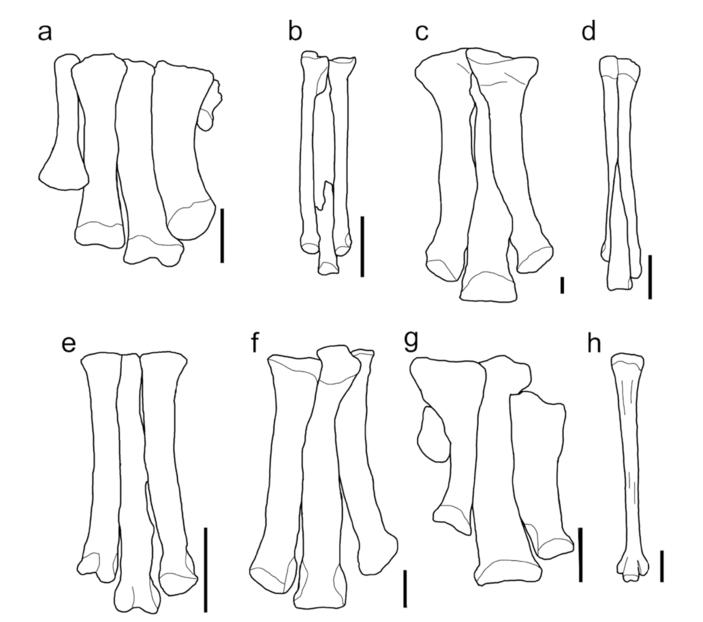
- Example metatarsi from this study (reduced metatarsal I may not be shown). a) Tenotosaurus tilletti (OMNH 58340), left metatarsus; b) Citipes elegans (CMNFV 37559), left metatarsus; c) Tyrannosaurus rex (FMNH PR 2081), right metatarsus; d) Struthiomimus (Dromiceiomimus) brevitertius (ROM 797), left metatarsus; e) Deinonychus antirrhopus (YPM 5205), right metatarsus; f) Allosaurus jimmadseni (MOR 693), left metatarsus; g) Thescelosaurus garbanii (LACM 33542), left metatarsus h) Dromaius novaehollandiae (TLG E005), left metatarsus. All scale bars equal 5 cm.
Evaluating MDA
Having devised some means of approximating toe splay from the foot skeleton, it was necessary to evaluate its performance. We first sought to assess intraobserver error in both measurements of MDA, thereby providing a baseline by which to gauge the significance of our later group comparisons. In the process of measuring MDA, we wondered whether there is anything inherent to the morphology of the metatarsals that might make some forms more difficult to measure precisely than others. For example, we considered whether larger animals having broader metatarsals are more difficult to measure precisely than smaller animals having narrower metatarsals, because it is easier to visually fit a line through a narrow metatarsal than a broad one. We similarly wondered whether tightly articulated metatarsals (e.g., arctometatarsalian forms; Holtz, 1995) yield more precise results than loosely articulated ones.
To investigate, we sought five species meeting each combination of these four criteria, representing both traditional dinosaurian orders (Tab. 1). We measured MDA for each metatarsus five times, using both methods presented above, then calculated the mean absolute error from these measurements (Tab. S2 of Supplementary Materials 1). We statistically compared mean absolute error values for the four categories given in Tab. 1 using a Kruskal-Wallis test for equal medians, given the small sample sizes involved (n = 5 for each category).
| Large | Small | |
|---|---|---|
| Tightly articulated | Tyrannosaurus rex | Sinornithomimus dongi |
| (FMNH PR 2081, right) | (IVPP V11797-23, left) | |
| Tarbosaurus bataar | Sinovenator changii | |
| (MPC-D 107/4, right) | (IVPP V12583, left) | |
| Gorgosaurus libratus | Stenonychosaurus inequalis | |
| (CMNFV 2120, right) | (TMP 1992.036.0575, right) | |
| Albertosaurus sarcophagus | Arkansaurus fridayi | |
| (AMNH 5232, right) | (UAM-74-16, right) | |
| Albertosaurus sarcophagus | Tochisaurus nemegtensis | |
| (TMP 1986.064.0001, left) | (PIN 551-224, left) | |
| Loosely articulated | Probactrosaurus gobiensis | Parksosaurus warreni |
| (PIN 2232/10, right) | (ROM 804, left) | |
| Mantellisaurus atherfieldensis | Valdosaurus canaliculatus | |
| (LH-30677, left) | (IWCMS 2013.175, left) | |
| Iguanodon bernissartensis | Orodromeus makelai | |
| (IRNSB 1534, right) | (MOR 530, left) | |
| Bactrosaurus johnsoni | Hypsilophodon foxii | |
| (AMNH 6553, left) | (NHMUK R196, left) | |
| Gobihadros mongoliensis | Nanosaurus agilis | |
| (MPC-D100/754, left) | (YPM VP 1882, left) |
Next, we sought to determine the agreement of the two methods we devised for measuring MDA. A preliminary Shapiro-Wilk test for normality shows that the measurements for MDA-1II-IV (n = 146, W = 0.95, p = 1.90 x 10⁻⁵) and MDA-2II-IV (n = 149, W = 0.98, p = 0.03) are significantly non-normal. Therefore, we assessed the agreement of the two methods using Spearman’s rank order correlation statistic (rS).
Finally, we evaluated the agreement between MDA and IDA. Because this cannot be done for non-avian dinosaurs without first knowing the identity of the trackmaker, we turned to an extant avian analogue: the emu (Dromaius novaehollandiae). Coauthor Farlow has studied emu trackways in detail (Farlow et al., 2018; also see Milân & Falkingham, 2016) and amassed a large database of trackway measurements over several years. Drawing from this larger database, we calculated mean IDAII-IV values for 36 individual birds, spanning juveniles through adults, moving across a range of substrate types (Tab. S3 of Supplementary Materials 1). We compared these to MDAII-IV measurements derived from a sample of skeletonised emu tarsometatarsi from 27 different captive individuals (18 adult, 8 immature) in the research collection of coauthor Green (Tab. S4 in Supplementary Materials 1). Most individuals appeared to be healthy, with only minor pathologies (i.e., small bone lesions or osteophytes). Two of the adults (TLG E024, TLG E057) possessed mid-shaft bone tumors, though their gait appeared unaffected in life. Two immature individuals in this sample (TLG E014, TLG E063) were affected by splayed-leg disorder (i.e., angular limb deformity in which the distal tibiotarsus and proximal tarsometatarsus develop some degree of lateral twist in one or both limbs; see Green, 2012). Because TLG E063 possessed only a very mild case of the disorder, we included it in our dataset. Likewise, we selected only the left, non-splaying leg of TLG E014 for our analysis. Similar to our non-avian dinosaur sample, the extant emus encompassed juveniles through adults, although the dataset is heavily biased towards the latter and includes no individuals with tarsometatarsus lengths between 15 and 30 cm. Nevertheless, preliminary Shapiro-Wilk tests showed that the distributions of all three variables are not significantly different from normal (emu IDAII-IV, W = 0.957, p = 0.225; emu MDA-1II-IV, W = 0.942, p = 0.136; emu MDA-2II-IV, W = 0.965, p = 0.477), so we compared mean values using a one-way analysis of variance with follow-up Tukey’s pairwise comparisons.
Ontogenetic allometry
Farlow et al. (2018) showed that IDAII-IV measured from emu tracks exhibits negative ontogenetic allometry; larger individuals tend to exhibit lower values. We sought to verify whether this is reflected in the foot skeleton using the emu tarsometatarsus dataset mentioned above to measure MDA and tarsometatarsus total length, a proxy for body size. We evaluated the relationship between these covariates using ordinary least squares regression.
We further examined the ontogenetic scaling of MDAII-IV in tridactyl dinosaur feet using the large theropods Allosaurus and Albertosaurinae (= Albertosaurus + Gorgosaurus) as models. These were chosen for their larger sample sizes, including sufficient growth stage coverage to capture ontogenetic variation in MDAII-IV (although the smallest body sizes are not represented, due to a lack of adequately preserved material). We considered Albertosaurus and Gorgosaurus together, because the two genera are so similar in form that some (e.g., Carr, 1999) consider them congeneric. We made no attempt to discriminate between congeneric species (e.g., Allosaurus fragilis vs. Allosaurus jimmadseni), on the informed assumption that such closely related species do not differ in their foot morphology.
Femur length scales predictably with body mass in tetrapods (Campione & Evans, 2012; Campione et al., 2014), including dinosaurs (O’Gorman & Hone, 2012), so we used this as an independent variable in our regressions. Because not all specimens preserving feet also preserve femora, we also used the length of metatarsal III as a proxy for body size, recognising that the metatarsus tends to be relatively shorter in increasingly larger individuals (Coombs, 1978; Carrano, 1999; Maidment & Barrett, 2012).
Phylogenetic allometry
Studies have disagreed about whether IDA varies with interspecific body size. Olsen (1995) found a positive correlation between footprint size and IDAII-IV in a sample from the Newark Supergroup of New Jersey; Lallensack et al. (2019) found no correlation in a more comprehensive, global sample (also see Farlow et al., 2025).
We tested for phylogenetic allometry in the corresponding foot skeleton using ordinary least squares regression, plotting MDAII-IV vs. femur length and metatarsal III length, as in the ontogenetic allometry tests above. Metatarsal III is greatly reduced in some taxa (e.g., some alvarezsauroids, oviraptorosaurs, paravians) or otherwise not preserved, so we used the average length of metatarsals II and IV to instead approximate the length of the metatarsus in these forms.
Group comparisons
Interdigital angle II-IV has been used to discriminate between some groups of tridactyl dinosaurs. For example, Lallensack et al. (2019) found that, at small body sizes, theropods differ from ornithischians in having smaller IDAII-IV values. However, unless there exist phenotypic differences in foot morphology that should give rise to such disparities, other explanations for these differences (such as substrate properties, trackmaker kinematics, and pathologies) are possible (Thulborn, 1990; McCrea et al., 2015; Hornung et al., 2016).
We tested the hypothesis of between-group differences in toe splay by first applying a size correction, which was necessary considering the allometric effects we document below. We used the residuals from the all-inclusive ordinary least squares regression described under ‘Phylogenetic allometry’ in the previous section. Preliminary Shapiro-Wilk testing showed significantly non-normal distributions of group residuals for the MDA-1II-IV and MDA-2II-IV datasets (Tab. S5 in Supplementary Materials 1). Therefore, we opted for Kruskal-Wallis comparison of group medians with followup Mann-Whitney U pairwise tests using sequential Bonferroni correction to minimize Type I error (outliers were deleted prior to testing).
Finally, we visually sought group differences in the divarication of metatarsals II and IV. For MDA-1, we plotted the left-right mean of metatarsal II angle vs. the left-right mean of metatarsal IV angle. For MDA-2, we plotted MDAII-III against MDAIII-IV. We fitted a trendline using reduced major axis regression.
MDA vs. IDA in non-avian dinosaurs
We compared MDAs with footprint IDAs using three overlapping footprint datasets from a previous study (Farlow et al., 2025). Dataset 1 (Tab. S6 in Supplementary Materials 1) comprised measurements made by coauthor Farlow on original fossil footprints, casts (negative copies; cf. Lallensack et al., 2025) of footprints, or 3D replicas printed from laser scans or photogrammetric models. Where data were available for more than one footprint in a trackway, mean values of parameters were calculated. Dataset 2 (Tab. S6 in Supplementary Materials 1) included measurements from Dataset 1, but also measurements made by Farlow from his own tracings of footprint outlines (taking means for multiple measured footprints in trackways). Farlow also took measurements from published drawings or photographs of morphologically well-preserved footprints from the published literature; for these, only one footprint was measured from each selected trackway. Interdigital angles II-III, III-IV, and II-IV in both datasets were made following the protocols of Farlow et al. (2018): angles were measured from best-fit lines drawn through the long axes of digits II, III, and IV (Fig. 1a, b); such lines were not constrained to pass through either the “heel” of the footprint or the tips of the toes, and where toes curved away from the midline, more emphasis was placed on the proximal end rather than the distal end of the toe mark. Angles were then measured from the intersections of the best-fit lines. Farlow’s data emphasised prints attributed to theropods, but some footprints attributed to gracile bipedal ornithischians were also measured.
Dataset 3 (Tab. S7 in Supplementary Materials 1) included measurements from Farlow’s Dataset 1, but also measurements extracted from the literature by Farlow for footprints attributed to theropods and gracile ornithischians as reported by the authors of studies. Footprint lengths in Dataset 3 are expressed in centimetres, rather than in millimetres as in datasets 1 and 2, to help distinguish between them. No attempt was made with Dataset 3 to deal with the fact that different authors measure angles following different protocols (cf. Thulborn, 1990; Camens & Worthy, 2019; Fig. 1); the hope was that the greater number of measurements would swamp variability introduced by different author measurement protocols. Only IDAII-IV measurements were collected for Dataset 3. As with Dataset 1, where measurements were available for more than one footprint in a trackway, the mean value of IDAII-IV was entered into the dataset.
RESULTS
Evaluation of MDA
The medians of the mean absolute error values for each of the four categories we examined are given in Tab. 2. Kruskal-Wallis tests show that the differences between the category medians are insignificant for both MDA-1II-IV (n = 20, H [X2] = 0.977, df = 3, p = 0.81) and MDA-2II-IV (n = 20, H [X2] = 5.42, df = 3, p = 0.14). Thus, we pursued no follow-up pairwise comparisons.
| Tightly articulated | Loosely articulated | |||
|---|---|---|---|---|
| Large | Small | Large | Small | |
| MDA-1II-IV | 2.90 ± 0.54 | 1.71 ± 0.70 | 2.60 ± 0.76 | 2.72 ± 0.77 |
| MDA-2II-IV | 2.15 ± 0.11 | 2.05 ± 0.55 | 1.65 ± 0.24 | 1.85 ± 0.38 |
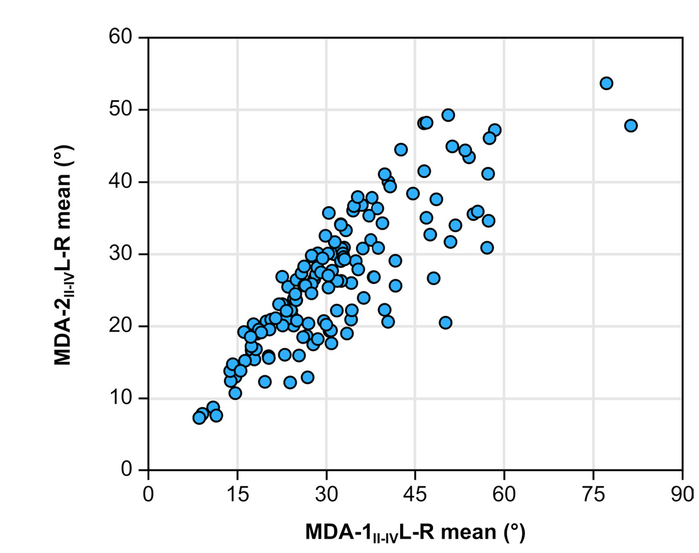
There is strong correlation between MDA-1II-IV and MDA-2II-IV (rS = 0.823, p = 1.0x10⁻⁴). Figure 4 shows that the correlation between the two methods decreases with increasing divarication angle; as MDAII-IV increases, the correspondence between methods decreases (i.e., high heteroscedasticity).
- Relationships of MDA-2II-IV vs. MDA-1II-IV. Note the heteroscedastic distribution.
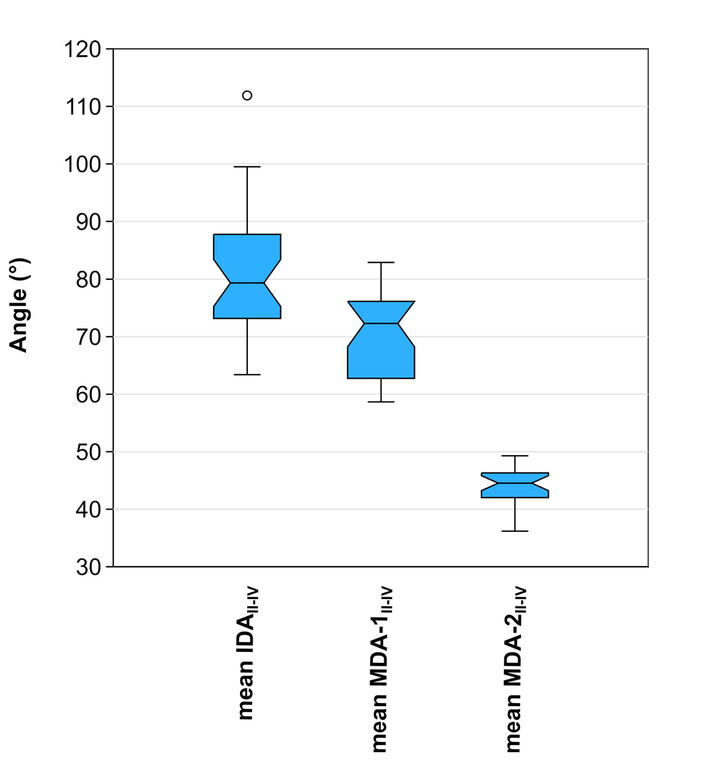
With respect to the extant emu data, MDA-1II-IV more closely approximates IDAII-IV than MDA-2II-IV (Fig. 5). Analysis of variance recovers significant differences between the means of these measures (F [2, 83] = 162, p = 1.0 x 10⁻⁵). The follow-up Tukey’s pairwise comparisons reveal significant differences between all combinations of mean IDAII-IV, mean MDA-1II-IV, and mean MDA-2II-IV (Tab. 3).
- Comparison of IDAII-IV with MDA-1II-IV and MDA-2II-IV in the emu (Dromaius novaehollandiae). Note that MDA-1II-IV better approximates IDAII-IV. Outliers beyond the ‘inner fences’ (1.5-3 times the box height from the box) are shown as circles.
| Mean IDAII-IV | Mean MDA-1II-IV | Mean MDA-2II-IV | |
|---|---|---|---|
| Mean IDAII-IV | 2.3x10⁻⁵* | 1.10x10⁻¹⁰* | |
| Mean MDA-1II-IV | 6.745 | 1.10x10⁻¹⁰* | |
| Mean MDA-2II-IV | 24.91 | 17.44 |
Ontogenetic allometry
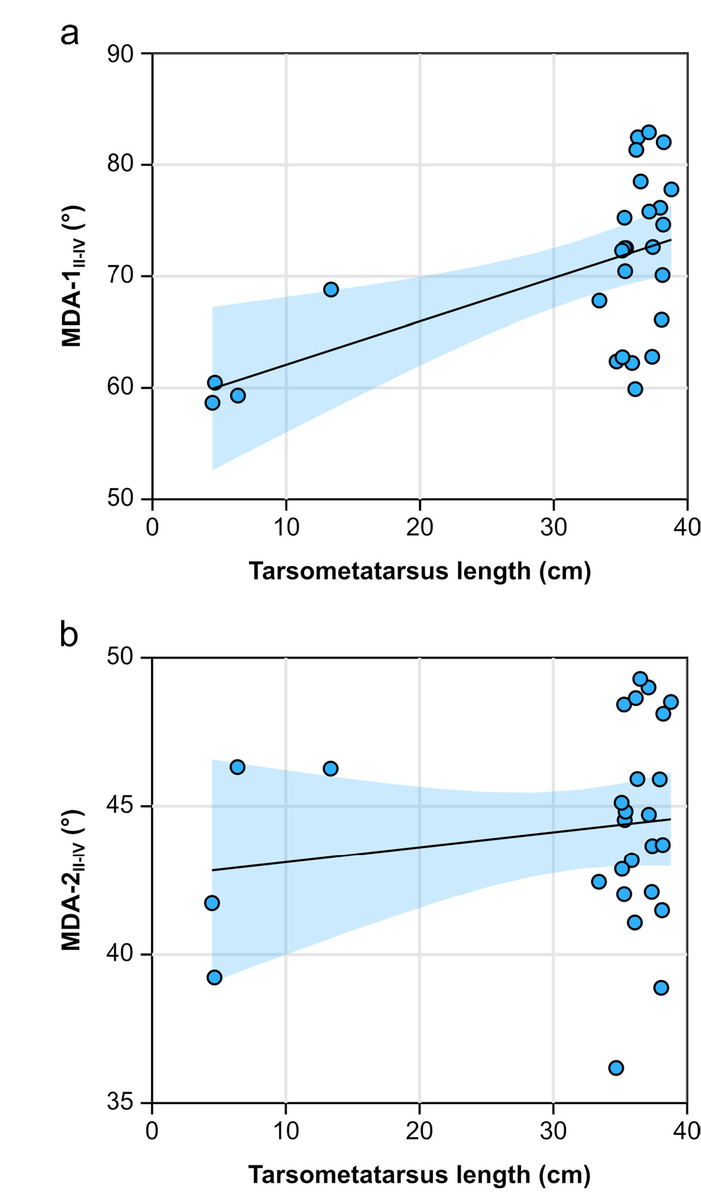
In the emu, correlation of MDAII-IV with tarsometatarsus total length is method dependent. Using MDA-1, there is a significant positive correlation with tarsometatarsus length; MDA-2 yields no correlation at all (Tab. 4, Fig. 6). The data are highly heteroscedastic, owing to the greater number of adults, violating some of the assumptions of ordinary least squares regression.
- Ontogenetic allometry MDAII-IV in the emu (Dromaius novaehollandiae) using a) MDA-1 and b) MDA-2. Note the strong heteroscedasticity in both plots.
| MDA- | Slope | Slope 95% CI | Intercept | r | t | pperm. |
|---|---|---|---|---|---|---|
| 1 | 0.39 | 0.24, 0.55 | 58.19 | 0.544 | 3.239 | 1.7x10⁻³* |
| 2 | 0.05 | -0.08, 0.17 | 42.60 | 0.162 | 0.821 | 0.421 |
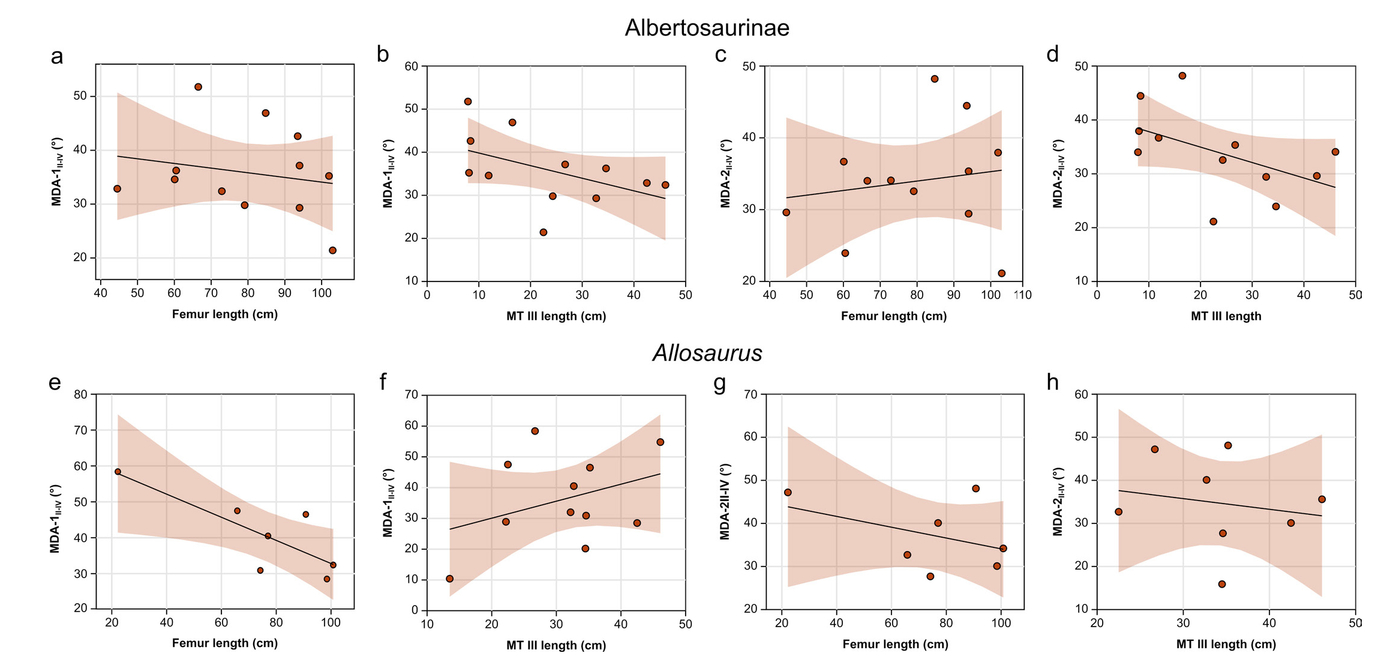
There is generally no significant correlation between size and MDAII-IV in either Allosaurus or the albertosaurines (Tab. 5); in only one case is there a significant relationship between femur length and MDA-1II-IV, but this is entirely due to a single data point at the small end of the size spectrum (Fig. 7e). The overall lack of significance is conceivably an issue of small sample size, although the generally low correlation coefficients in both Albertosaurinae and Allosaurus suggest otherwise.
- Ontogenetic allometry in Albertosaurinae and Allosaurus using different body size proxies and MDAII-IV measurements. Albertosaurinae: a) MDA-1II-IV vs. femur length; b) MDA-1II-IV vs. metatarsal III length; c) MDA-2II-IV vs. femur length; d) MDA-2II-IV vs. metatarsal III length; Allosaurus: e) MDA-1II-IV vs. femur length; f) MDA-1II-IV vs. metatarsal III length; g) MDA-2II-IV vs. femur length; h) MDA-2II-IV vs. metatarsal III length. Abbreviation: MT, metatarsal.
| Taxon | MDA- | Regressor | n | Slope | Slope 95% CI | Intercept | r | t | pperm |
|---|---|---|---|---|---|---|---|---|---|
| Albertosaurinae | 1 | Femur length | 12 | -0.087 | -2.25, 0.62 | 42.749 | -0.206 | -0.206 | 0.528 |
| 1 | MT III length | 12 | -0.29 | -0.55, 0.07 | 42.74 | -0.481 | -1.736 | 0.116 | |
| 2 | Femur length | 12 | 0.066 | -0.18, 0.31 | 28.73 | 0.154 | 0.494 | 0.635 | |
| 2 | MT III length | 12 | -0.29 | -0.49, 0.03 | 40.70 | -0.503 | -1.840 | 0.0979 | |
| Allosaurus | 1 | Femur length | 7 | 0.55 | -0.68, -0.12 | 19.03 | -0.798 | -2.965 | 0.0217* |
| 1 | MT III length | 11 | -0.32 | -0.15, 2.26 | 65.03 | 0.352 | 1.128 | 0.294 | |
| 2 | Femur length | 7 | -0.25 | -0.65, 0.03 | 43.19 | -0.415 | -1.020 | 0.373 | |
| 2 | MT III length | 8 | -0.13 | -1.03, 0.88 | 46.65 | -0.178 | -0.442 | 0.674 |
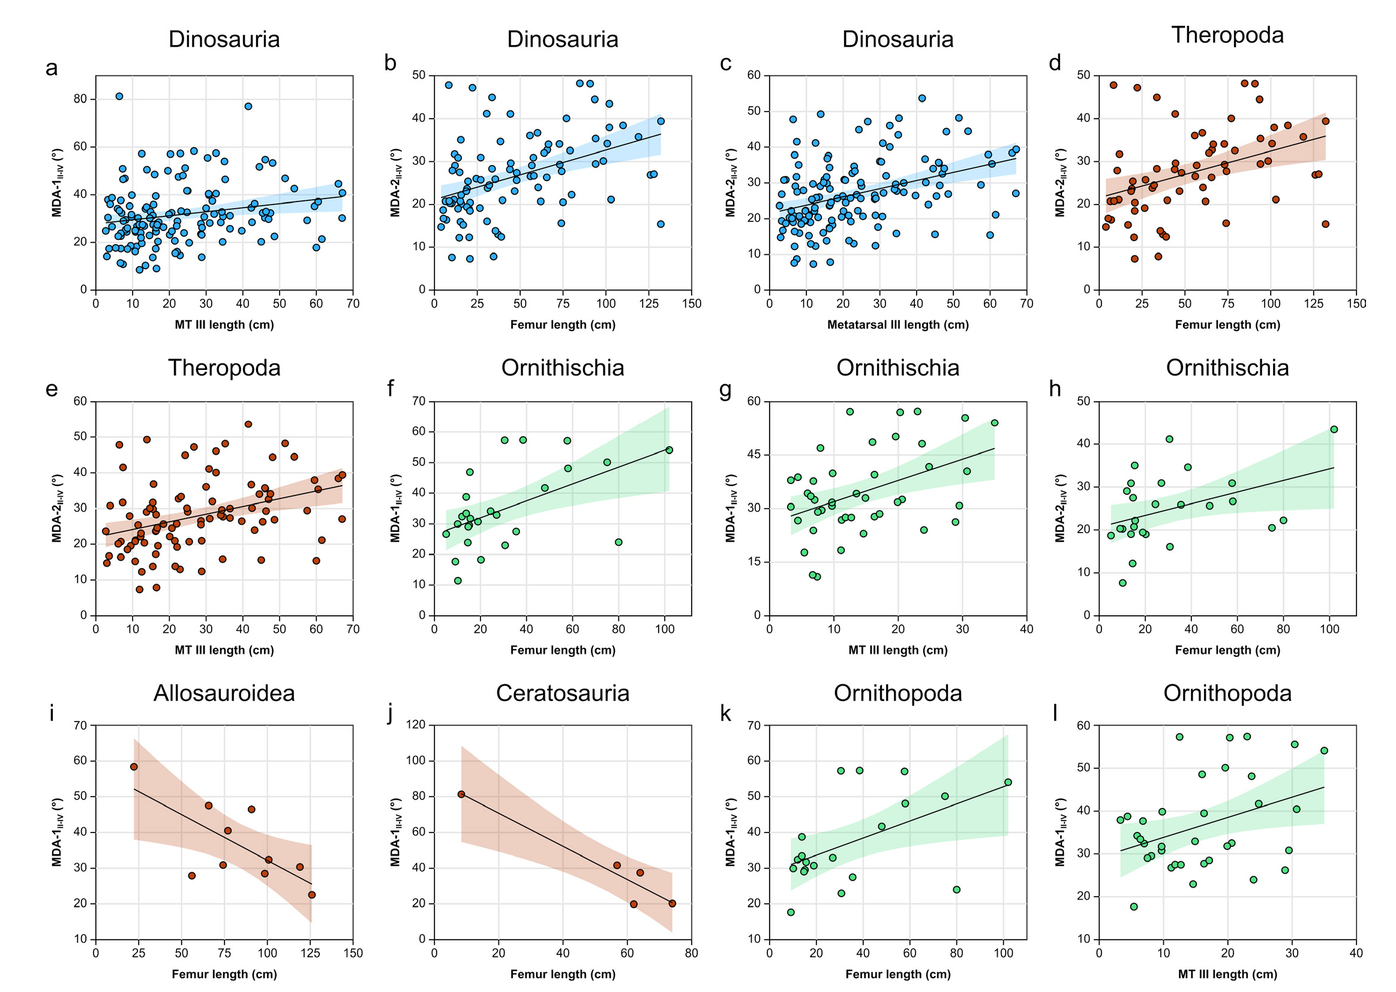
Phylogenetic allometry
At the highest taxonomic level (Dinosauria), there is a generally weak (albeit, statistically significant) positive relationship between MDAII-IV and body size, irrespective of the method used (Tab. 6, Fig. 8). These findings broadly maintain at the level of Theropoda and particularly Ornithischia. However, with increased taxonomic resolution (and correspondingly decreased sample size), this relationship weakens to the point of insignificance, with but a few exceptions. Allosauroidea and Ceratosauria show a weak, negative relationship between femur length and MDAII-IV, and Ornithopoda shows a weak, positive relationship with respect to both femur length and metatarsal length (Tab. 6, Fig. 8). Thus, the weak, positive relationship between body size and MDAII-IV across Dinosauria appears to be at least partially influenced by phylogeny, whereby the relationship either breaks down with increased taxonomic resolution (and correspondingly decreased sample size) or else becomes inverted.
- Phylogenetic allometry of MDAII-IV for various dinosaur clades, showing only statistically significant relationships (also see Tab. 6). a) MDA-1II-IV vs. metatarsal III length in Dinosauria; b) MDA-2II-IV vs. femur length in Dinosauria; c) MDA-2II-IV vs. metatarsal III length in Dinosaura; d) MDA-2II-IV vs. femur length in Theropoda; e) MDA-2II-IV vs. metatarsal III length in Theropoda; f) MDA-1II-IV vs. femur length in Ornithischia; g) MDA-1II-IV vs. metatarsal III length in Ornithischia; h) MDA-2II-IV vs. femur length in Ornithischia; i) MDA-1II-IV vs. femur length in Allosauroidea; j) MDA-1II-IV vs. femur length in Ceratosauria; k) MDA-1II-IV vs. femur length in Ornithopoda; l) MDA-1II-IV vs. metatarsal III length in Ornithopoda. Abbreviation: MT, metatarsal.
| Taxon | MDA- | Regressor | n | Slope | Slope 95% CI | Int. | r | t | pperm. |
|---|---|---|---|---|---|---|---|---|---|
| Dinosauria | 1 | Femur length | 93 | 0.069 | -0.01, 0.14 | 28.31 | 0.190 | 1.845 | 0.0711 |
| 1 | MT III length | 142 | 0.17 | 0.03, 0.28 | 27.84 | 0.211 | 2.554 | 0.0125* | |
| 2 | Femur length | 93 | 0.23 | 0.06, 0.17 | 21.51 | 0.419 | 4.404 | 1x10⁻⁴* | |
| 2 | MT III length | 142 | 0.23 | 0.14, 0.32 | 21.51 | 0.382 | 4.834 | 1x10⁻⁴* | |
| Theropoda | 1 | Femur length | 65 | 0.059 | -0.03, 0.16 | 27.22 | 0.169 | 1.362 | 0.174 |
| 1 | MT III length | 97 | 0.059 | 0.04, 0.36 | 27.22 | 0.169 | 1.362 | 0.18 | |
| 2 | Femur length | 65 | 0.11 | 0.04, 0.18 | 21.55 | 0.390 | 3.363 | 2.3x10⁻³* | |
| 2 | MT III length | 97 | 0.21 | 0.11, 0.32 | 21.97 | 0.364 | 3.747 | 3x10⁻⁴* | |
| Ornithischia | 1 | Femur length | 26 | 0.28 | 0.01, 0.48 | 26.46 | 0.532 | 3.08 | 4.2x10⁻³* |
| 1 | MT III length | 43 | 0.60 | 0.21, 0.99 | 25.96 | 0.432 | 3.066 | 4.3x10⁻³* | |
| 2 | Femur length | 26 | 0.14 | 0.01, 0.27 | 20.69 | 0.412 | 2.213 | 0.0388* | |
| 2 | MT III length | 43 | 0.29 | 0.02, 0.60 | 20.62 | 0.304 | 2.042 | 0.0509 | |
| Allosauroidea | 1 | Femur length | 10 | -0.26 | -0.51, -0.14 | 57.85 | -0.706 | -2.818 | 0.0205* |
| 1 | MT III length | 13 | 0.40 | -0.50, 1.43 | 23.44 | 0.236 | 0.877 | 0.392 | |
| 2 | Femur length | 10 | -0.09 | -0.33, 0.02 | 42.18 | -0.340 | -1.023 | 0.341 | |
| 2 | MT III length | 13 | -0.035 | -0.77, 0.53 | 36.29 | -0.0270 | -0.0853 | 0.932 | |
| Alvarezsauroidea | 1 | Femur length | 4 | 1.01 | -2.24, 12.48 | 12.84 | 0.748 | 1.593 | 0.121 |
| 1 | MT III length | 5 | 0.85 | 0.28, 1.45 | 14.34 | 0.836 | 2.638 | 0.113 | |
| 2 | Femur length | 4 | 0.60 | -2.03, 9.84 | 14.21 | 0.638 | 1.173 | 0.461 | |
| 2 | MT III length | 5 | 0.63 | 0.15, 1.06 | 14.35 | 0.818 | 2.465 | 0.134 | |
| Basal ornithischian | 1 | Femur length | 5 | 0.42 | -0.79, 1.64 | 16.62 | 0.377 | 0.704 | 0.542 |
| 1 | MT III length | 7 | 0.23 | -2.32, 5.31 | 20.52 | 0.0904 | 0.203 | 0.839 | |
| 2 | Femur length | 5 | 0.53 | -0.35, 2.03 | 8.82 | 0.579 | 1.231 | 0.321 | |
| 2 | MT III length | 7 | 0.23 | -1.03, 4.70 | 20.52 | 0.0904 | 0.203 | 0.839 | |
| Ceratosauria | 1 | Femur length | 5 | -0.93 | -1.53, -0.03 | 89.38 | -0.954 | -5.519 | 0.0493* |
| 1 | MT III length | 6 | -1.37 | -5.33, -0.46 | 80.87 | -0.738 | -2.189 | 0.103 | |
| 2 | Femur length | 5 | -0.93 | -1.13, 0.19 | 89.38 | 0.0541 | 0.108 | 0.912 | |
| 2 | MT III length | 6 | -1.37 | -3.75, -0.15 | 80.87 | -0.622 | -1.590 | 0.180 | |
| Coelophysoidea | 1 | Femur length | 4 | 0.41 | -13.84, 1.29 | 15.85 | 0.813 | 1.971 | 0.2097 |
| 1 | MT III length | 4 | 0.81 | -8.86, 1.16 | 12.81 | 0.924 | 3.412 | 0.0808 | |
| 2 | Femur length | 4 | 0.41 | -14.83, 1.79 | 15.85 | 0.885 | 2.691 | 0.207 | |
| 2 | MT III length | 4 | 0.81 | -8.99, 1.63 | 12.81 | 0.968 | 5.452 | 0.0846 | |
| Ornithomimosauria | 1 | Femur length | 11 | -0.12 | -0.50, 0.39 | 31.13 | -0.376 | -1.217 | 0.198 |
| 1 | MT III length | 16 | -0.27 | -0.85, 0.10 | 34.30 | -0.390 | -1.584 | 0.132 | |
| 2 | Femur length | 11 | -0.12 | -0.33, 0.09 | 31.13 | -0.380 | -1.231 | 0.270 | |
| 2 | MT III length | 16 | -0.27 | -0.50, 0.03 | 34.30 | -0.231 | -0.888 | 0.397 | |
| Ornithopoda | 1 | Femur length | 20 | 0.24 | 0.002, 0.45 | 28.87 | 0.513 | 2.538 | 0.0200* |
| 1 | MT III length | 35 | 0.47 | 0.09, 0.85 | 29.16 | 0.375 | 2.323 | 0.0271* | |
| 2 | Femur length | 20 | 0.24 | -0.02, 0.24 | 28.87 | 0.369 | 1.687 | 0.113 | |
| 2 | MT III length | 35 | 0.47 | -0.15, 0.47 | 29.16 | 0.186 | 1.088 | 0.284 | |
| Oviraptorosauria | 1 | Femur length | 3 | -0.09 | -8.51, 0.32 | 27.78 | -0.153 | -0.155 | 1 |
| 1 | MT III length | 12 | -1.45 | -2.92, 1.07 | 49.18 | -0.417 | -1.451 | 0.178 | |
| 2 | Femur length | 3 | -0.09 | -2.36, 0.09 | 27.78 | -0.136 | -0.137 | 1 | |
| 2 | MT III length | 12 | -1.45 | -2.13, 1.20 | 49.18 | -0.329 | -1.100 | 0.299 | |
| Paraves | 1 | Femur length | 8 | 0.08 | -0.26, 0.68 | 21.86 | 0.128 | 0.316 | 0.767 |
| 1 | MT III length | 18 | 0.22 | -0.18, 0.78 | 24.20 | 0.189 | 0.771 | 0.455 | |
| 2 | Femur length | 8 | 0.08 | -0.07, 0.66 | 21.86 | 0.452 | 1.242 | 0.249 | |
| 2 | MT III length | 18 | 0.22 | -0.05, 0.77 | 24.20 | 0.331 | 1.403 | 0.173 | |
| Tyrannosauroidea | 1 | Femur length | 17 | 0.08 | -0.08, 0.29 | 28.34 | 0.236 | 0.941 | 0.359 |
| 1 | MT III length | 18 | 0.21 | -0.12, 0.83 | 25.31 | 0.259 | 1.072 | 0.297 | |
| 2 | Femur length | 17 | 0.08 | -0.05, 0.28 | 28.34 | 0.376 | 1.570 | 0.142 | |
| 2 | MT III length | 18 | 0.21 | 0.001, 0.78 | 25.31 | 0.387 | 1.678 | 0.118 |
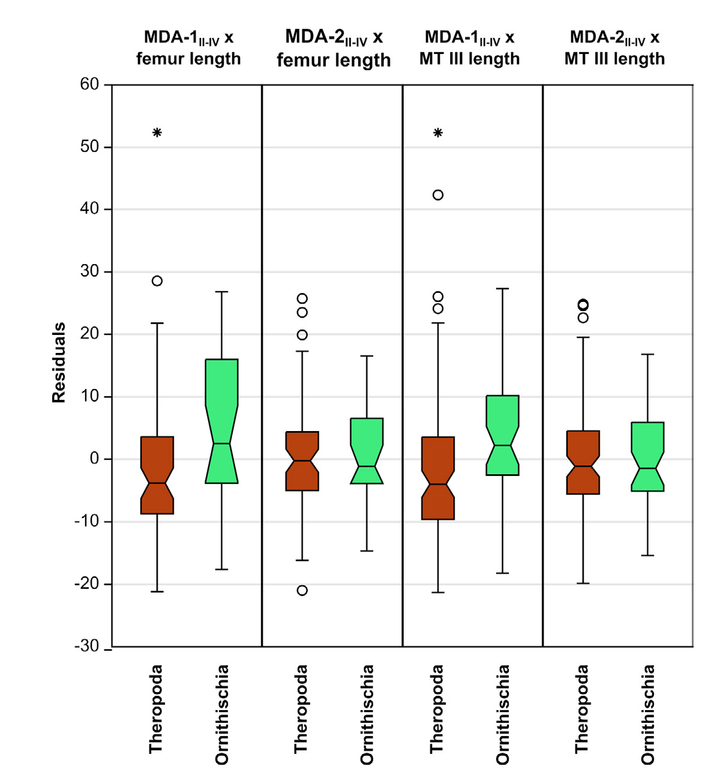
Group comparisons
Metatarsal divarication angle II-IV overlaps considerably between theropods and ornithischians (Fig. 9), but theropods (MDA-1II-IV mean = 30.32°, median = 28.20°) have slightly, albeit statistically significantly, lower angles than ornithischians (MDA-1II-IV mean = 34.39°, median = 32.45°) with respect to MDA-1 (Tab. 7). These between-group differences are greater than the intraobserver variance (Tab. 2).
- Distribution of size-corrected residuals of MDA-1II-IV and MDA-2II-IV for Theropoda and Ornithischia using femur and metatarsal III length as size proxies. Note that group differences using MDA-1II-IV are significant (Tab. 7). Outliers beyond the ‘inner fences’ (1.5–3 times the box height from the box) are shown as circles; outliers beyond the ‘outer fences’ (> 3 times the box height from the box) are shown as stars. Abbreviation: MT, metatarsal.
| MDA- | Regressor | n | U | p (equal) |
|---|---|---|---|---|
| 1 | Femur length | 88 | 515 | 2.6568 8.2x10⁻³* |
| 1 | MT III length | 135 | 1146 | 3.9269 2.0x10⁻⁴* |
| 2 | Femur length | 83 | 670 | 0.1984 0.8427 |
| 2 | MT III length | 133 | 1856 | 0.37762 0.7101 |
When taxonomic resolution is increased, group MDAII-IV values are, on average, more tightly constrained using MDA-2, perhaps mostly notably for Allosauroidea, Ceratosauria, and Ornithopoda; MDA-1 yields slightly more constrained angles for Coelophysoidea (Fig. 10). This variance between methods does not appear to be a function of sample size. Ceratosaurs are among the most variable of the groups, ranging from 20° (Ceratosaurus and Deltadromeus) to 80° (Velocisaurus) for MDA-1, despite having one of the smallest sample sizes (n = 6).
- Box-and-whisker plots showing between-group differences (corrected for body size) in a) MDA-1II-IV (femur length regressor); b) total MDA-2II-IV (femur length regressor); c) MDA-1II-IV (metatarsal III length regressor); d, MDA-2II-IV (metatarsal III length regressor). Outliers beyond the ‘inner fences’ (1.5-3 times the box height from the box) are shown as circles; outliers beyond the ‘outer fences’ (> 3 times the box height from the box) are shown as stars.
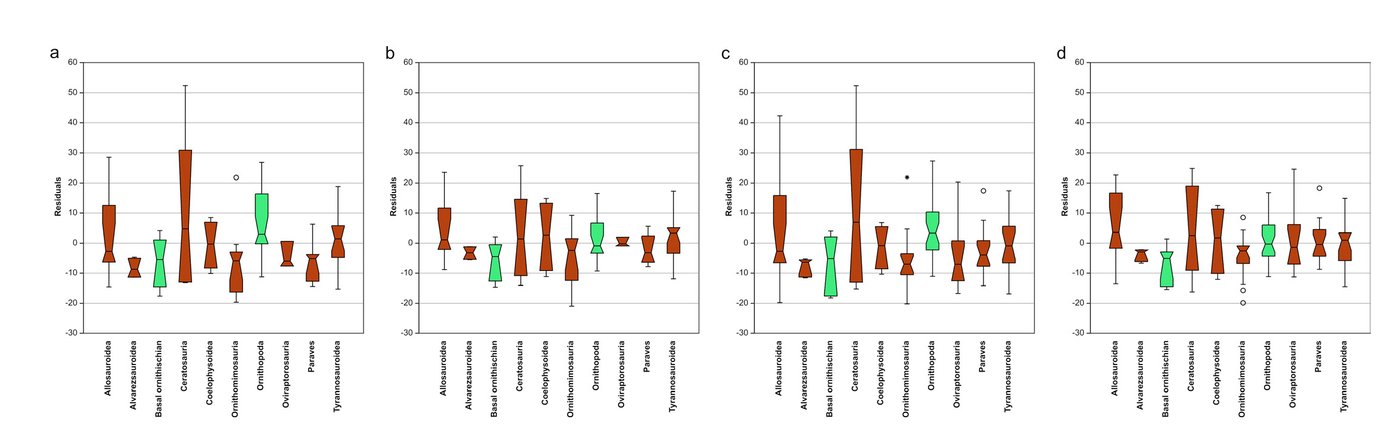
While there is much overlap in MDAII-IV for all groups, allosauroids and ceratosaurs consistently have higher median MDAII-IV values than other groups, ranging 30°–40° (Fig. 10). Ornithopoda also falls in this range using MDA-1. The other groups cluster around 20°–30° for both methods. Groups including functionally didactyl (Paraves) and tetradactyl forms (Oviraptorosauria) are indistinguishable from tridactyl dinosaurs.
Kruskal-Wallis tests show significant between-group differences in median MDAII-IV using MDA-1 but not MDA-2, although associated p-values are consistently low (Tab. 8). Followup Mann-Whitney U pairwise comparisons for the MDA-1 datasets show that ornithopods differ significantly from ornithomimosaurs and paravians, though the uncorrected comparisons yield other differences of possible interest (Tabs. 9 and 10). Ornithopoda is among the best represented groups (n = 37) in our dataset, which may account for the added power of the statistical comparisons.
| MDA- | Regressor | H(X2) | p |
|---|---|---|---|
| 1 | Femur length | 22.86 | 6.51x10⁻³* |
| 1 | MT III length | 33.21 | 1.23x10⁻⁴* |
| 2 | Femur length | 10.78 | 0.291 |
| 2 | MT III length | 14.27 | 0.113 |
| Allosauroidea | Alvarezsauroidea | Basal ornithischian | Ceratosauria | Coelophysoidea | Ornithomimosauria | Ornithopoda | Oviraptorosauria | Paraves | Tyrannosauroidea | |
|---|---|---|---|---|---|---|---|---|---|---|
| Allosauroidea | 0.104 | 0.298 | 0.951 | 0.944 | 0.0376 | 0.322 | 0.447 | 0.143 | 0.900 | |
| Alvarezsauroidea | 8 | 0.903 | 0.713 | 0.112 | 0.832 | 9.46x10⁻³ | 0.377 | 0.445 | 0.0439 | |
| Basal ornithischian | 16 | 9 | 0.403 | 0.391 | 0.668 | 0.0383 | 1 | 0.942 | 0.159 | |
| Ceratosauria | 25 | 8 | 8 | 0.903 | 0.198 | 0.709 | 0.766 | 0.341 | 0.638 | |
| Coelophysoidea | 19 | 2 | 6 | 9 | 0.104 | 0.261 | 0.596 | 0.149 | 0.823 | |
| Ornithomimosauria | 22 | 18 | 21 | 14 | 8 | 6.51×10⁻⁴* | 0.447 | 0.625 | 3.89x10⁻³ | |
| Ornithopoda | 77 | 6 | 19 | 44 | 25 | 22 | 0.0913 | 5.58×10⁻³ | 0.166 | |
| Oviraptorosauria | 10 | 3 | 7 | 6 | 4 | 10 | 11 | 0.919 | 0.204 | |
| Paraves | 23 | 11 | 20 | 13 | 7 | 34 | 25 | 11 | 0.0583 | |
| Tyrannosauroidea | 82 | 11 | 24 | 36 | 31 | 27 | 124 | 13 | 35 |
| Allosauroidea | Alvarezsauroidea | Basal ornithischian | Ceratosauria | Coelophysoidea | Ornithomimosauria | Ornithopoda | Oviraptorosauria | Paraves | Tyrannosauroidea | |
|---|---|---|---|---|---|---|---|---|---|---|
| Allosauroidea | 0.116 | 0.259 | 0.669 | 0.803 | 0.0279 | 0.236 | 0.213 | 0.290 | 0.871 | |
| Alvarezsauroidea | 19 | 0.626 | 0.411 | 0.111 | 0.601 | 2.16x10⁻³ | 0.712 | 0.137 | 0.0483 | |
| Basal ornithischian | 36 | 14 | 0.134 | 0.395 | 0.672 | 0.0114 | 0.767 | 0.611 | 0.193 | |
| Ceratosauria | 39 | 10 | 10 | 0.594 | 0.129 | 0.897 | 0.206 | 0.248 | 0.368 | |
| Coelophysoidea | 27 | 3 | 9 | 9 | 0.147 | 0.172 | 0.431 | 0.263 | 0.966 | |
| Ornithomimosauria | 59 | 31 | 46 | 25 | 15 | 7.19x10⁻⁶* | 0.393 | 0.104 | 5.08x10⁻³ | |
| Ornithopoda | 206 | 12 | 47 | 101 | 40 | 50 | 2.80x10⁻³ | 2.85x10⁻⁴* | 0.0346 | |
| Oviraptorosauria | 64 | 26 | 38 | 22 | 17 | 72 | 87 | 0.642 | 0.212 | |
| Paraves | 99 | 23 | 51 | 34 | 21 | 84 | 111 | 91 | 0.192 | |
| Tyrannosauroidea | 130 | 18 | 41 | 40 | 35 | 57 | 202 | 78 | 113 |
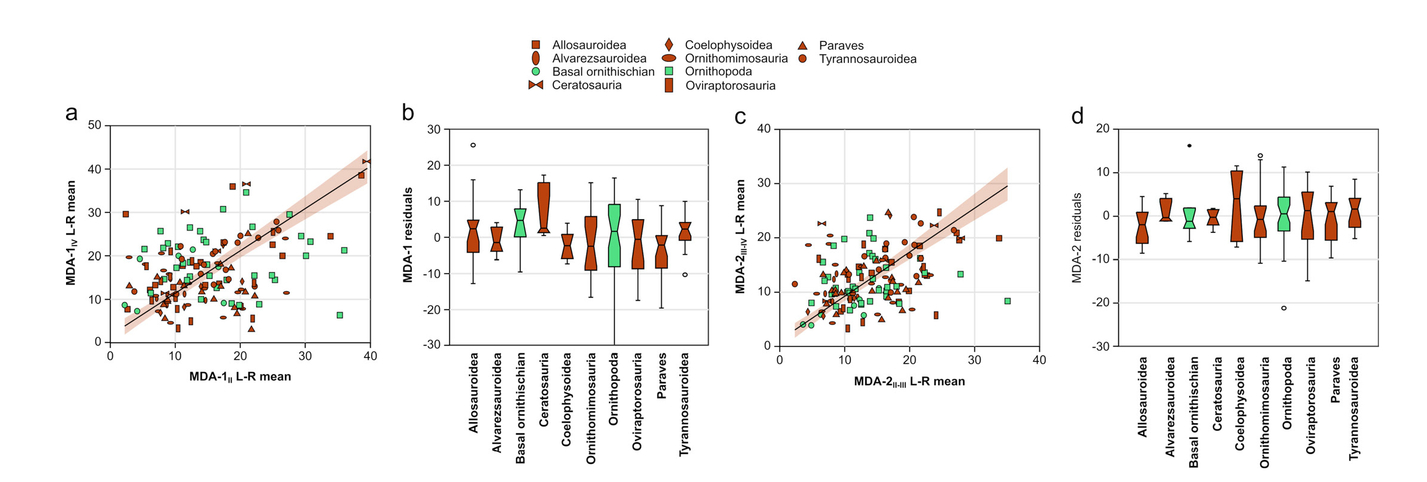
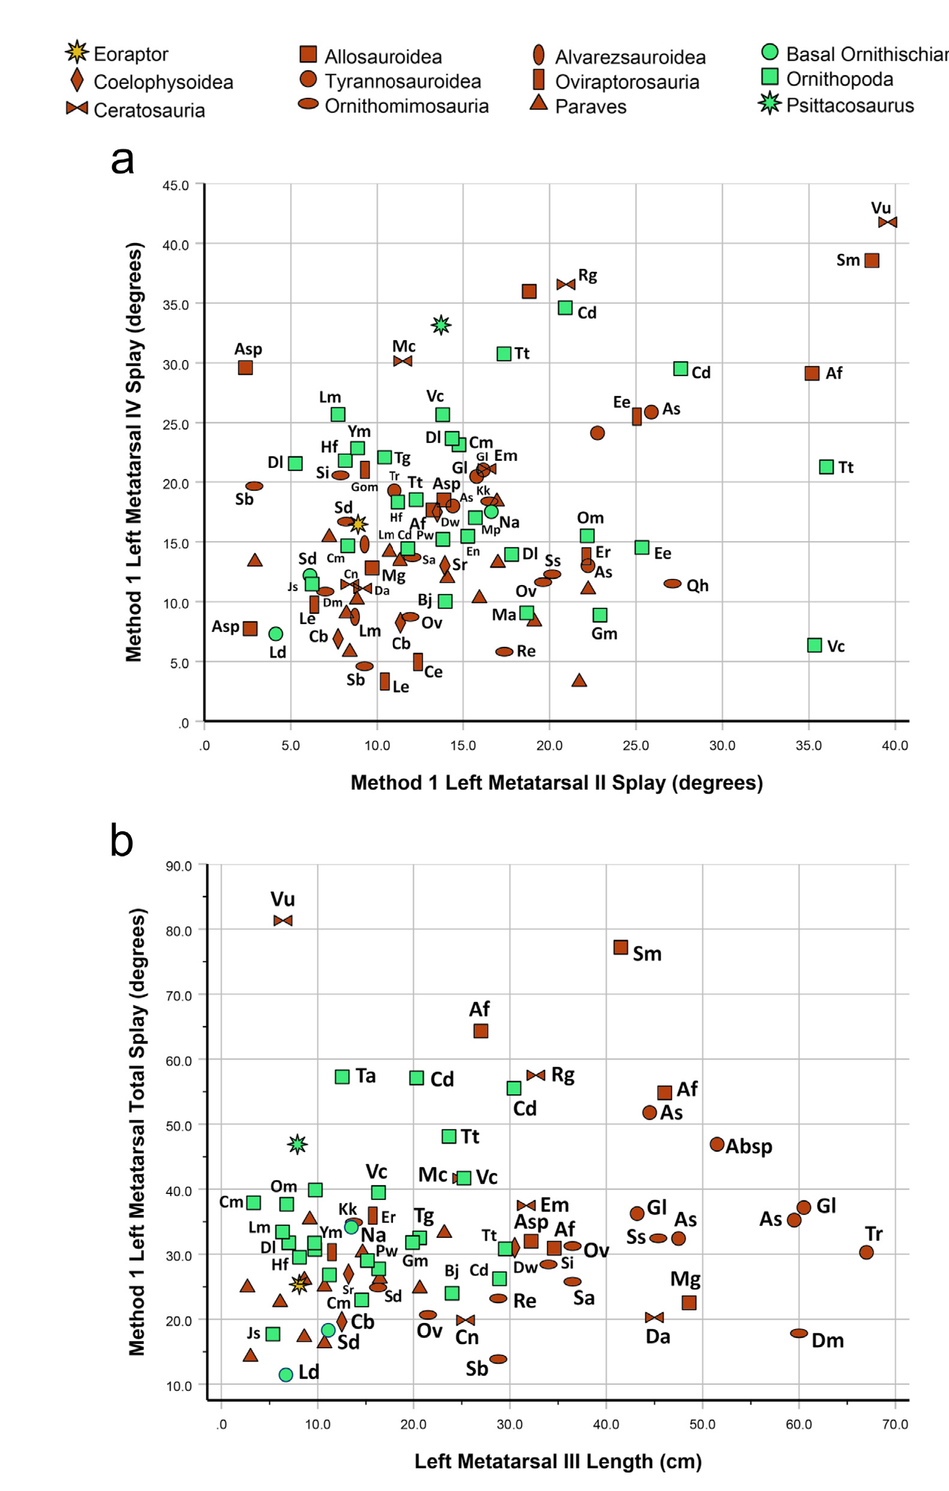
Comparing the divarication of the inner and outer metatarsals, there is a positive trend whereby metatarsals II and IV splay apart subequally, regardless of the method employed, although the variance about the reduced major axis trendline is high (Fig. 11). There is broad overlap of taxonomic groups—particularly with respect to MDA-2—most of which are evenly distributed about the trendline. Some exceptions stand out: ‘basal ornithischians’, ceratosaurs, and tyrannosauroids generally have a more divergent metatarsal IV with respect to MDA-1. Using the same metric, coelophysoids and paravians arguably have a more divergent metatarsal II. Allosauroids likewise show a more divergent metatarsal II in relation to MDA-2.
- Reduced major axis regression (with bootstrapped 95% confidence intervals) of a) MDA-1M vs. MDA-1IV and c) MDA-2II-m vs. MDA-2III-IV. Corresponding box-and-whisker plots in b) and d), respectively, show group residuals. For the box-and-whisker plots, outliers beyond the ‘inner fences’ (1.5-3 times the box height from the box) are shown as circles.
MDA vs. IDA in non-avian dinosaurs
Comparing our MDA data with footprint IDAs is complicated. Interdigital angles are affected not only by pedal morphology, but also by locomotor kinematics and the foot-substrate interaction, a matter we will consider below. Furthermore, the dinosaur skeletal taxa for which we have MDA data are, in many cases, unlikely to have been the same taxa responsible for the footprints in our sample. In addition, we must assume that published identifications of trackmakers as theropods or ornithischians are correct. While this is likely true for larger footprints, for smaller prints the distinction between trackmakers as theropods or ornithischians can be more problematic (cf. Castanera et al., 2013; Farlow et al., 2018). If small to medium-sized footprints were identified as ornithischian mainly because they have large interdigital angles, it is then circular reasoning to claim that larger IDAs are a feature of ornithischian prints. This caveat should be kept in mind in the discussions that follow; we will describe tridactyl footprints as “attributed to” theropods or ornithischians. Yet another complication is that our MDA data show substantial variability, not just within particular dinosaur clades, but even among metatarsals belonging to members of the same genus (Fig. 12).
- Metatarsal divarication within clades. For clades other than Paraves (because these dinosaurs are less likely to have impressed typical tridactyl footprints), points of species or genera are labeled with abbreviations, where possible without excessive clutter. Data are measurements of MDA-1 using left metatarsals. a) MDA-1IV vs. MDA-1II; b) MDA-1II-IV vs. metatarsal III length. Key to species labels: Absp = Albertosaurus sp.; Af = Allosaurus fragilis; As = Albertosaurus sarcophagus; Asp = Allosaurus sp.; Bj = Bactrosaurus johnsoni; Cb = Coelophysis bauri; Cd = Camptosaurus dispar; Ce = Citipes elegans; Cm = Convolosaurus marri; Cn = Ceratosaurus nasicornis; Da = Deltadromeus agilis; Dl = Dysalotosaurus lettowvorbecki; Dm = Deinocheirus mirificus; Dw = Dilophosaurus wetherilli; Ee = Elmisaurus elegans; Em = Eoabelisaurus mefi; En = Eousdryosaurus nanohallucis; Er = Elmisaurus rarus; Hf = Hypsilophodon foxii; Gl = Gorgosaurus libratus; Gm = Gobihadros mongoliensis (Ornithopoda) or Gobiraptor minutus (Oviraptorosauria)—note different symbols on figures; Js = Jeholosaurus shangyuanensis; Kk = Kinnareemimus khinkaenensis; Ld = Lesothosaurus diagnosticus; Le = Leptorhynchus elegans; Lm = Linhenykus monodactylus (Alvarezsauroidea) or Laosaurus minimus (Ornithopoda)—note different symbols on figures; Ma = Mantellisaurus atherfieldensis; Mc = Majungasaurus crenatissimus; Mg = Meraxes gigas; Mp = Maiasaurua peeblesorum; Msp = Mononykus sp.; Na = Nanosaurus agilis; Om = Orodromeus makelai; Ov = Ornithomimus velox; Pw = Parksosaurus warren; Qh = Qiupalong henanensis; Re = Rativates evadens; Rg = Rahiolisaurus gujaratensis; Sa = Struthiomimus altus; Sb = Struthiomimus (or Dromiceiomimus) brevitertius; Sd = Stormbergia dangershoeki (basal Ornithischia) or Sinornithomimus dongi (Ornithomimosauria); Si = Struthiomimus “ingens”; Sm = Saurophaganax maximus; Sr = Coelophysis (formerly Syntarsus) rhodesiensis; Ss = Struthiomimus “sedens”); Tg = Thescelosaurus garbanii; Tr = Tyrannosaurus rex; Tt = Tenontosaurus tilletti; Vc = Valdosaurus canaliculatus; Vn = Velocisaurus unicus; Ym = Yandosaurus multidens.
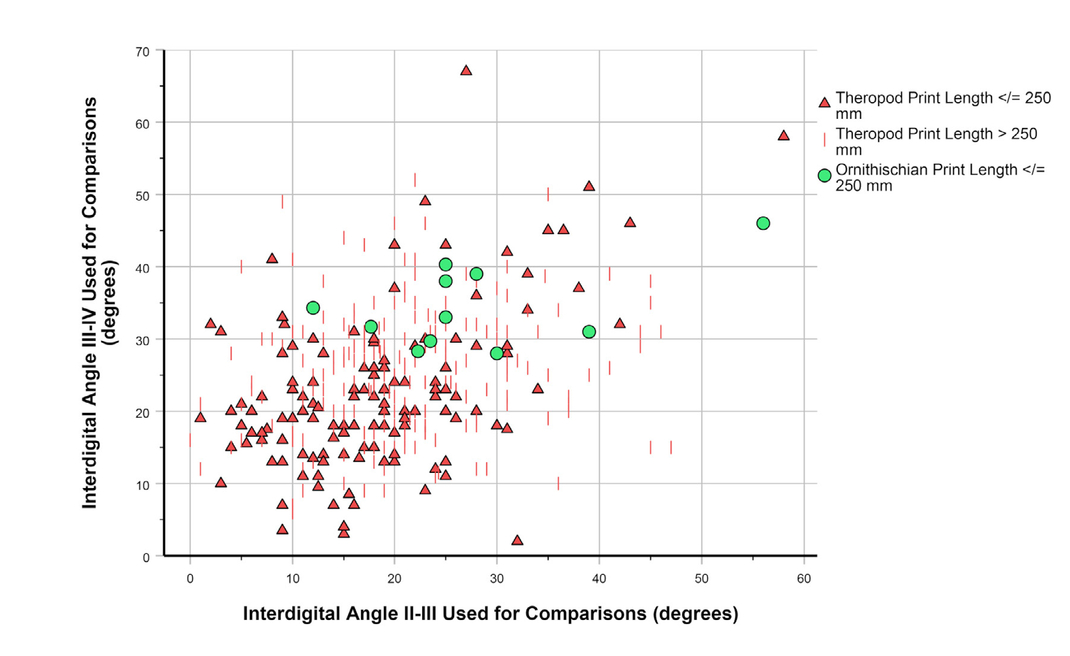
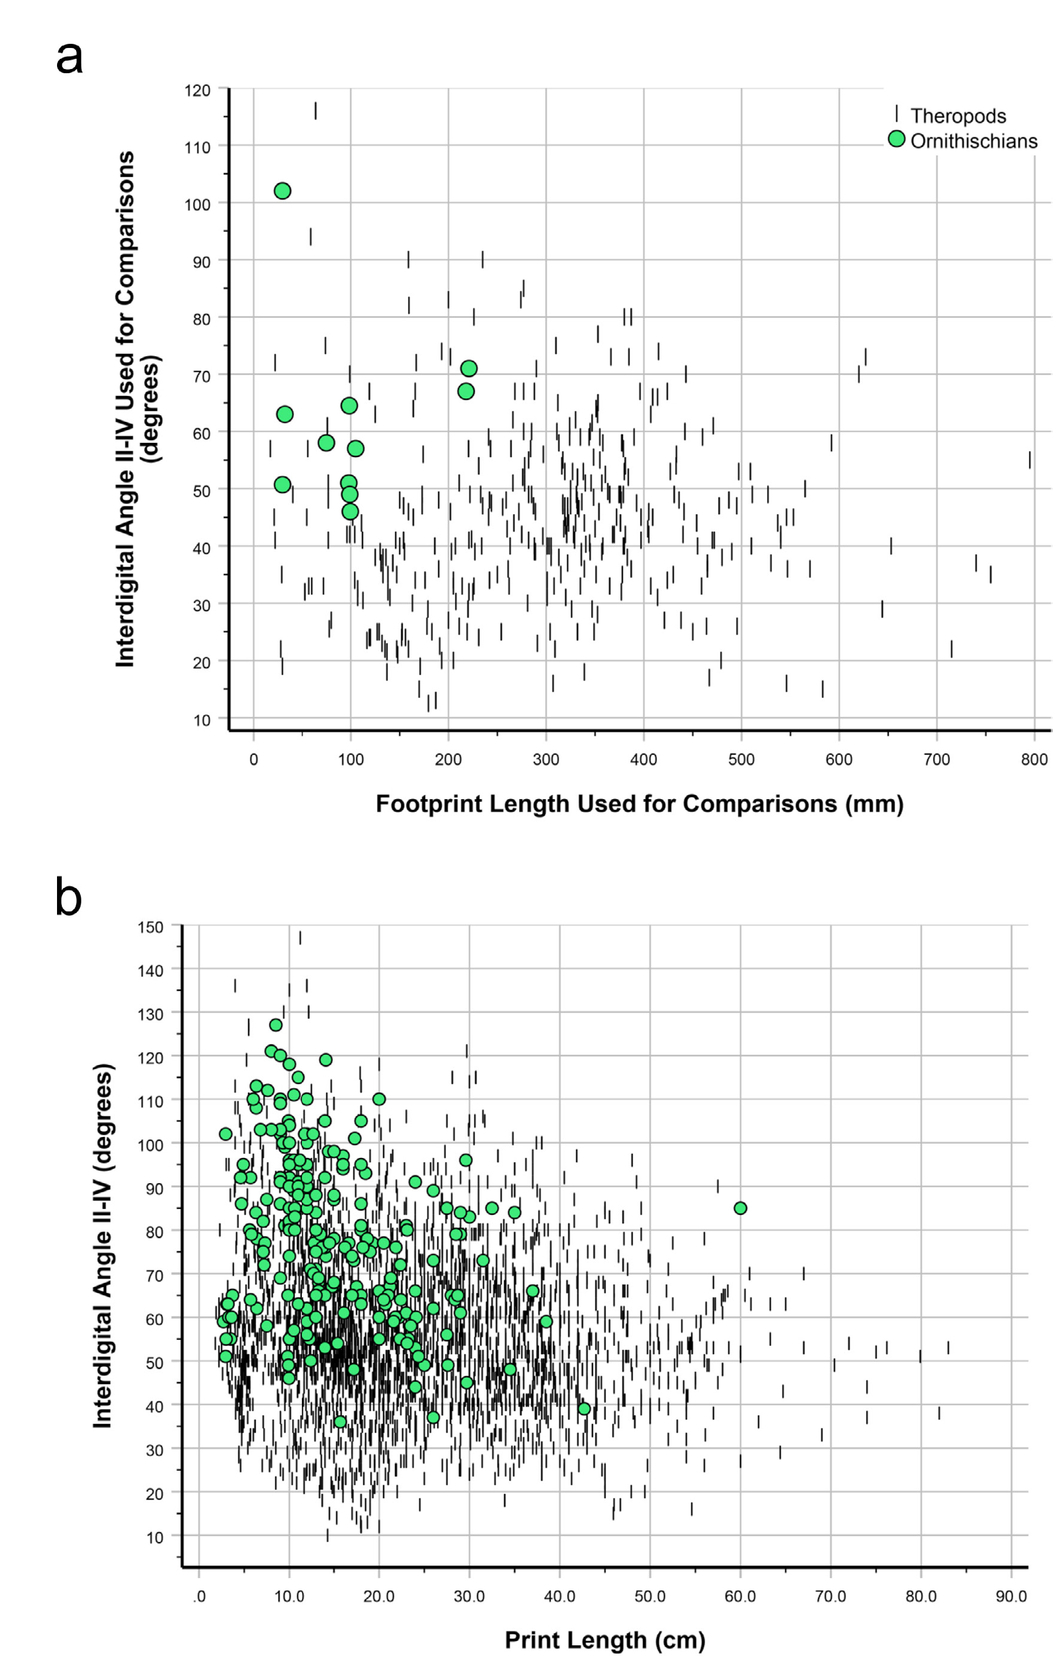
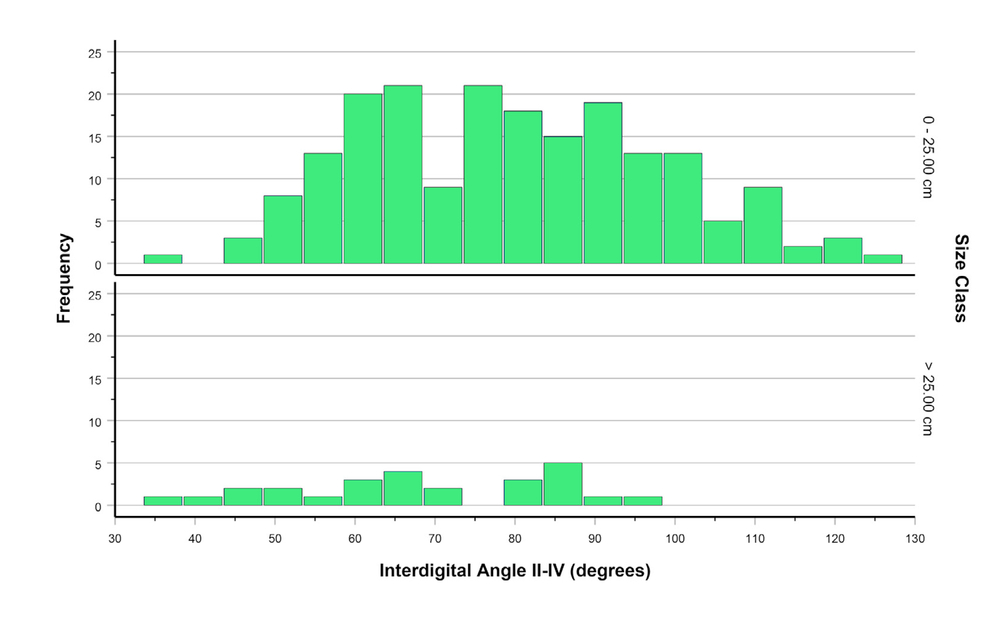
As with divarication data for metatarsals II and IV (Figs. 11 and 12), footprint IDAs III-IV and II-III are positively correlated (Fig. 13; Pearson’s r = 0.378; p < 0.001; N = 390). As noted above, MDA-1II-IV for the entire dinosaur sample shows only weak correlation with the length of metatarsal III (Figs. 8A, 12B), but some outlier cases hint at a possible narrowing of divarication values in larger theropods. Interdigital angle II-IV, with many more data, shows a more convincing narrowing—particularly a decrease in the maximum value—with increasing footprint size (Figs. 14—16), especially for theropods. Although IDAII-IV measurements attributed to ornithischians completely overlap those attributed to theropods, there is a large sample of footprints (especially Grallator and Anchisauripus), attributed to small theropods, that show much narrower IDAII-IV values than do putative ornithischian footprints (cf., Fig. 9a, Farlow et al., 2018, 2025).
IDA vs. IDA (Dataset 2; the phrase “used for comparisons” on axes here and elsewhere identifies data from that dataset) in footprints attributed to theropods and small ornithischians.
- IDAII-IV as a function of footprint size. A, Dataset 2. B, Dataset 3 (Note difference in units of footprint length between the two datasets).
- IDAII-IV for footprints attributed to theropods, broken down by size class. a) Dataset 2; b) Dataset 3, see Tab. 13 for an additional breakdown of IDAII-IV by size class for Dataset 3.
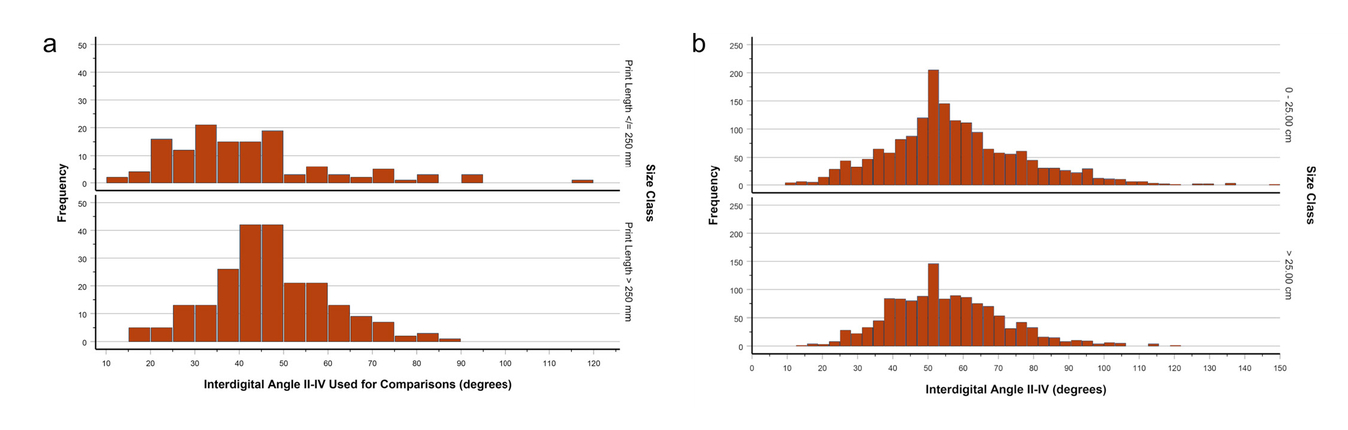
- IDAII-IV of footprints attributed to ornithischians (Dataset 3), broken down by size class.
In his classic study, Thulborn (1990: 158) reported that IDAs II-III and III-IV of most small theropods (“coelurosaurs” in his usage) “are roughly equal,” “with total divarication (II-IV) being in the range 45°–50°.” Large theropods collectively (“carnosaurs” in Thulborn’s usage) also had roughly equal IDAs II-III and III-IV; “The total divarication of digits II-IV is often about 50°–60°, though occasionally it may be as low as 35° or as high as 75°” (Thulborn, 1990: pp. 147-148).
In ornithomimids “Digit IV is slightly more divergent than digit II, with interdigital angles about 35° (II-III) and 44° (III-IV),” and IDAII-IV is about 78° (Thulborn, 1990: 163). Small ornithopods often have “subequal” values of IDAs II-III and III-IV, with IDAII–IV “commonly about 60°, though it is sometimes as low as 40° or as high as 80°” (Thulborn, 1990: 184).
For large theropods in our metatarsal dataset (Tab. 11), allosauroids and tyrannosauroids have subequal metatarsal divarications, while ceratosaurs may have larger metatarsal IV than metatarsal II divarications (Fig. 11a, b). Metatarsal divarication angle II-IV of these three clades averages 30°–40°. For large theropods collectively, IDAII-IV averages 45°–55°, and IDAII-III is about the same as IDAIII-IV (Tab. 12). Our IDA data seem qualitatively consistent with Thulborn’s (1990) observations, although our IDAs, like those reported by Thulborn, are a bit larger than our MDAs, which is consistent with our emu data (Fig. 5).
| Group | Bone | Parameter | Minimum | Maximum | Median | Mean | n |
|---|---|---|---|---|---|---|---|
| Herrerasaurus | Metatarsal II | Length | 14.2R | 1R | |||
| Divarication | 3.4R | 1R | |||||
| Metatarsal III | Length | 16.5R | 1R | ||||
| Metatarsal IV | Length | 14.3R | 1R | ||||
| Divarication | 5.7R | 1R | |||||
| MDAII-IV | 9.1R | 1R | |||||
| Eoraptor | Metatarsal II | Length | 7.2L | 1L | |||
| Divarication | 8.9L | 1L | |||||
| Metatarsal III | Length | 8.1L | 1L | ||||
| Metatarsal IV | Length | 7.4L | 1L | ||||
| Divarication | 16.5L | 1L | |||||
| MDAII-IV | 25.3L | 1L | |||||
| Coelophysoidea | Metatarsal II | Length | 9.4L | 26.0L | 11.90L | 15.78L | 3L |
| Divarication | 7.7L | 13.9L | 12.44L | 11.64L | 4L | ||
| Metatarsal III | Length | 12.5L | 30.5L | 13.20L | 18.73L | 3L | |
| Metatarsal IV | Length | 9.5L | 26.6L | 11.70L | 15.94L | 3L | |
| Divarication | 6.9L | 17.5L | 10.61L | 11.40L | 4L | ||
| MDAII-IV | 14.6L | 31.0L | 23.27L | 23.04L | 4L | ||
| Ceratosauria | Metatarsal II | Length | 5.6L | 41.7L | 24.42L | 24.29L | 6L |
| Divarication | 8.4L | 39.6L | 13.94L | 17.66L | 6L | ||
| Metatarsal III | Length | 6.4L | 45.0L | 28.55L | 27.70L | 6L | |
| Metatarsal IV | Length | 5.6L | 40.0L | 23.62L | 23.34L | 6L | |
| Divarication | 11.1L | 41.8L | 25.63L | 25.35L | 6L | ||
| MDAII-IV | 19.9L | 81.3L | 39.57L | 43.01L | 6L | ||
| Allosauroidea | Metatarsal II | Length | 18.2R | 41.5R | 27.00R | 28.88R | 9R |
| Divarication | 6.9R | 32.6R | 17.44R | 19.00R | 9R | ||
| Metatarsal III | Length | 22.5R | 46.0R | 33.60R | 33.55R | 8R | |
| Metatarsal IV | Length | 19.5R | 36.0R | 27.50R | 28.08R | 9R | |
| Divarication | 8.5R | 23.1R | 17.78R | 16.88R | 9R | ||
| MDAII-IV | 20.2R | 52.5R | 30.37R | 35.88R | 9R | ||
| Ornitholestes | Metatarsal II | Length | 10.9R | 1R | |||
| Divarication | 3.1R | 1R | |||||
| Metatarsal III | Length | 11.9R | 1R | ||||
| Metatarsal IV | Length | 11.3R | 1R | ||||
| Divarication | 5.4R | 1R | |||||
| MDAII-IV | 8.6R | 1R | |||||
| Zuolong | Metatarsal II | Divarication | 18.9R | 1R | |||
| Metatarsal III | Length | 24.3R | 1R | ||||
| Metatarsal IV | Divarication | 32.4R | 1R | ||||
| MDAII-IV | 51.3R | 1R | |||||
| Tyrannosauroidea | Metatarsal II | Length | 19.6R | 63.8R | 47.40R | 46.17R | 10R |
| Divarication | 3.7R | 25.6R | 17.63R | 15.76R | 11R | ||
| Metatarsal III | Length | 21.6R | 67.1R | 54.00R | 50.78R | 9R | |
| Metatarsal IV | Length | 20.2R | 62.0R | 49.50R | 47.17R | 10R | |
| Divarication | 11.2R | 27.8R | 16.83R | 18.60R | 11R | ||
| MDAII-IV | 15.5R | 53.4R | 33.01R | 34.36R | 11R | ||
| Ornithomimosauria | Metatarsal II | Length | 12.5L | 49.7L | 29.94L | 29.76L | 12L |
| Divarication | 2.9L | 27.1L | 12.00L | 13.33L | 12L | ||
| Metatarsal III | Length | 13.8L | 60.0L | 31.40L | 32.15L | 10L | |
| Metatarsal IV | Length | 13.4L | 55.3L | 30.40L | 30.5L | 11L | |
| Divarication | 4.6L | 20.6L | 11.96L | 12.86L | 12L | ||
| MDAII-IV | 13.9L | 38.6L | 25.32L | 26.20L | 12L | ||
| Alvarezsauroidea | Metatarsal II | Length | 5.4R | 10.8R | 6.73R | 7.64R | 3R |
| Divarication | 7.1R | 14.7R | 11.42R | 11.07R | 3R | ||
| Metatarsal IV | Length | 5.4R | 10.8R | 6.95R | 7.73R | 3R | |
| Divarication | 9.8R | 11.2R | 10.24R | 10.42R | 3R | ||
| MDAII-IV | 17.4R | 24.4R | 22.66R | 21.48R | 3R | ||
| Oviraptorosauria | Metatarsal II | Length | 12.3R | 20.8R | 15.97R | 16.17R | 6R |
| Divarication | 5.6R | 21.9R | 10.04R | 11.06R | 7R | ||
| Metatarsal IV | Length | 12.3R | 19.5R | 16.18R | 16.10R | 6R | |
| Divarication | 5.6R | 18.8R | 14.20R | 12.80R | 7R | ||
| MDAII-IV | 18.1R | 31.4R | 23.23R | 23.86R | 7R | ||
| Basal ornithischians | Metatarsal II | Length | 3.3R | 6.7R | 5.10R | 5.04R | 4R |
| Divarication | 2.2R | 17.5R | 10.50R | 9.49R | 5R | ||
| Metatarsal III | Length | 3.3R | 7.4R | 5.60R | 5.49R | 4R | |
| Metatarsal IV | Length | 3.1R | 6.4R | 5.10R | 4.92R | 4R | |
| Divarication | 8.7R | 36.0R | 19.31R | 15.71R | 5R | ||
| MDAII-IV | 10.9R | 34.1R | 26.63R | 25.20R | 5R | ||
| Ornithopoda | Metatarsal II | Length | 2.8L | 25.3L | 12.79L | 13.04L | 25L |
| Divarication | 5.3L | 36.0L | 14.36L | 16.15L | 27L | ||
| Metatarsal III | Length | 3.3L | 30.4L | 15.15L | 15.78L | 25L | |
| Metatarsal IV | Length | 2.7L | 25.6L | 12.77L | 13.17L | 25L | |
| Divarication | 6.4L | 34.6L | 18.42L | 18.82L | 28L | ||
| MDAII-IV | 17.7L | 57.3L | 31.79L | 34.89L | 27L | ||
| Psittacosaurus | Metatarsal II | Divarication | 13.7L | 1L | |||
| Metatarsal III | Length | 7.9L | 1L | ||||
| Metatarsal IV | Divarication | 33.2L | 1L | ||||
| MDAII-IV | 46.9L | 1L |
| Group | Dataset | Size Class | Parameter | Range | Median/Mean | SD | n |
|---|---|---|---|---|---|---|---|
| Theropods (worldwide) | 2 | Footprint Length ≤ 250 mm | Footprint Length | 28–244 | 163.5/159.2 | 52.1 | 92 |
| IDAII-III | 1–58 | 17.0/18.3 | 9.8 | 129 | |||
| IDAIII-IV | 2–67 | 20.0/22.5 | 11.1 | 128 | |||
| IDAII-IV | 13–116 | 38.0/41.3 | 18.3 | 131 | |||
| Footprint Length > 250 mm | Footprint Length | 256–740 | 369.7/380.2 | 75.7 | 189 | ||
| IDAII-III | 0–47 | 20.0/20.9 | 9.0 | 218 | |||
| IDAIII-IV | 6–52 | 25.0/25.4 | 8.5 | 217 | |||
| IDAII-IV | 15–85 | 46.0/46.4 | 13.4 | 223 | |||
| Grallator (eastern and western North America; note that some authors include Anchisauripus within Grallator) | 1 | Footprint Length | 60–163 | 107.0/104.4 | 33.2 | 11 | |
| IDAII-III | 9–26 | 12.7/14.2 | 5.0 | 12 | |||
| IDAIII-IV | 14–28 | 18.5/18.7 | 4.7 | 12 | |||
| IDAII-IV | 23–48 | 32.7/33.1 | 6.9 | 12 | |||
| Grallator (worldwide, including some possible Anchisauripus) | 2 | Footprint Length | 17–321 | 125.0/138.2 | 75.1 | 32 | |
| IDAII-III | 7–33 | 17.0/17.7 | 6.7 | 33 | |||
| IDAIII-IV | 13–43 | 20.5/21.3 | 7.7 | 33 | |||
| IDAII-IV | 23–72 | 38.0/39.1 | 12.2 | 33 | |||
| Coelophysis | Left MT II Splay | 7.7–13.9 | 11.37/11.02 | 3 | |||
| Left MT IV Splay | 6.9–13.0 | 8..37 | 3 | ||||
| Left MDAII-IV | 14.6–26.9 | 19.61/20.39 | 3 | ||||
| Anchisauripus (mainly eastern North America) | 1 | Footprint Length | 96–326 | 164.0/174.0 | 48.4 | 41 | |
| IDAII-III | 1–25 | 12.0/12.3 | 6.2 | 49 | |||
| IDAIII-IV | 3–32 | 15.5/15.6 | 6.8 | 47 | |||
| IDAII-IV | 13–54 | 26.0/28.1 | 8.8 | 47 | |||
| Eubrontes (worldwide) | 1 | Footprint Length | 289–413 | 333.5/343.6 | 39.0 | 15 | |
| IDAII-III | 5–28 | 15.3/15.7 | 6.0 | 16 | |||
| IDAIII-IV | 12–31 | 19.5/20.0 | 5.4 | 16 | |||
| IDAII-IV | 22–50 | 35.0/35.7 | 8.1 | 16 | |||
| Eubrontes (worldwide including East Berlin Formation (Connecticut) footprints | 2 | Footprint Length | 154–480 | 348.7/350.4 | 46.9 | 86 | |
| IDAII-m | 4–47 | 20.0/21.2 | 9.7 | 87 | |||
| IDAIII-IV | 9–49 | 24.0/24.4 | 7.6 | 86 | |||
| IDAII-IV | 18–80 | 46.0/45.4 | 12.8 | 88 | |||
| East Berlin Formation (Connecticut) footprints; probably most or all are Eubrontes) | 1 | Footprint Length | 171–440 | 344.3/343.0 | 44.5 | 26 | |
| IDAII-III | 4–37 | 19.0/17.9 | 7.1 | 27 | |||
| IDAIII-IV | 9–36 | 23.0/22.6 | 6.8 | 27 | |||
| IDAII-IV | 18–59 | 44.0/40.4 | 10.5 | 27 | |||
| Dilophosaurus | Left MT II Splay | 13.5 | 1 | ||||
| Right MT II Splay | 20.3–21.2 | 20.77/20.77 | 2 | ||||
| Left MT IV Splay | 17.5 | 1 | |||||
| Right MT IV Splay | 14.1–27.5 | 20.83/20.83 | 2 | ||||
| Left MDAII-IV | 31.0 | 1 | |||||
| Right MDAII-IV | 34.4–48.8 | 41.60/41.60 | 2 | ||||
| Kayentapus (worldwide) | 1 | Footprint Length | 119–396 | 266.0/276.0 | 80.0 | 9 | |
| IDAii-iii | 9–33 | 22.0/22.7 | 7.6 | 9 | |||
| IDAIII-IV | 26–39 | 32.0/32.2 | 4.0 | 9 | |||
| IDAII-IV | 41–67 | 48.0/53.9 | 10.2 | 9 | |||
| 2 | Footprint Length | 119–427 | 274.0/287.5 | 76.3 | 18 | ||
| IDAii-iii | 9–39 | 22.5/22.0 | 8.4 | 18 | |||
| IDAIII-IV | 22–51 | 31.5/31.3 | 7.1 | 18 | |||
| IDAII-IV | 33–90 | 49.0/52.8 | 13.4 | 18 | |||
| Megalosauripus Europe, western North America) | 1 | Footprint Length | 414–540 | 457.5/467.3 | 53.0 | 4 | |
| IDAII-III | 6–21 | 13.0/13.3 | 7.4 | 4 | |||
| IDAIII-IV | 17–24 | 21.0/20.7 | 3.8 | 4 | |||
| IDAII-IV | 25–42 | 34.0/33.7 | 7.4 | 4 | |||
| Megalosauripus (worldwide) | 2 | Footprint Length | 311–795 | 476.0/497.0 | 109.6 | 14 | |
| IDAII-III | 5–31 | 20.0/19.1 | 8.7 | 13 | |||
| IDAIII-IV | 12–46 | 24.0/26.5 | 9.7 | 13 | |||
| IDAII-IV | 25–66 | 45.0/45.8 | 10.9 | 14 | |||
| Irenesauripus (western North America, South Korea) | 1 | Footprint Length | 222–511 | 331.5/353.7 | 104.4 | 6 | |
| IDAII-III | 5–25 | 12.5/13.2 | 7.0 | 6 | |||
| IDAIII-IV | 21–41 | 27.5/29.5 | 7.0 | 6 | |||
| IDAII-IV | 27–53 | 44.5/42.8 | 9.5 | 6 | |||
| Lower Cretaceous Theropods Texas and Arkansas | 1 | Footprint Length | 216–537 | 380.0/379.1 | 97.7 | 37 | |
| IDAII-III | 1–41 | 19.3/19.0 | 8.1 | 36 | |||
| IDAIII-IV | 7–41 | 21.0/22.6 | 9.0 | 36 | |||
| IDAIII-IV | 17–80 | 41.0/42.5 | 13.9 | 35 | |||
| Allosaurus | Left MT II Splay | 2.4–35.2 | 13.57/14.37 | 12.1 | 6 | ||
| Right MT II Splay | 6.9–32.6 | 20.05/19.95 | 9.0 | 7 | |||
| Left MT IV Splay | 7.7–36.0 | 23.81/23.10 | 10.3 | 6 | |||
| Right MT IV Splay | 8.5–23.1 | 19.89/17.86 | 5.3 | 7 | |||
| Left MDAII-IV | 10.4–64.3 | 32.18/37.46 | 19.3 | 6 | |||
| Right MDAII-IV | 20.2–52.5 | 40.49/37.81 | 12.0 | 7 | |||
| Albertosaurus | Left MT II Splay | 14.4–25.9 | 22.50/21.32 | 4 | |||
| Right MT II Splay | 13.9–19.6 | 16.84/16.80 | 4 | ||||
| Left MT IV Splay | 13.0–25.9 | 21.07/20.26 | 4 | ||||
| Right MT IV Splay | 13.4–23.0 | 16.35/17.28 | 4 | ||||
| Left MDAII-IV | 32.4–51.8 | 41.07/41.58 | 4 | ||||
| Right MDAII-IV | 29.3–42.6 | 32.20/24.08 | 4 | ||||
| Gorgosaurus | Left MT II Splay | 15.8–16.2 | 15.98/15.98 | 2 | |||
| Right MT II Splay | 10.2–18.2 | 14.19/14.19 | 2 | ||||
| Left MT IV Splay | 20.5–21.0 | 20.73/20.73 | 2 | ||||
| Right MT IV Splay | 11.2–14.6 | 12.95/12.95 | 2 | ||||
| Left MDAII-IV | 36.2–37.2 | 36.70/36.70 | 2 | ||||
| Right MDAII-IV | 21.4–32.9 | 27.13/27.13 | 2 | ||||
| Tarbosaurus | Right MT II Splay | 10.8–25.6 | 18.21/18.21 | 2 | |||
| Right MT IV Splay | 22.2–27.8 | 25.01/25.01 | 2 | ||||
| Right MDAII-IV | 33.0–53.4 | 43.22/43.22 | 2 | ||||
| Tyrannosaurus | Left MT II Splay | 11.0 | 1 | ||||
| Right MT II Splay | 17.6–20.0 | 18.83/18.83 | 2 | ||||
| Left MT IV Splay | 19.3 | 1 | |||||
| Right MT IV Splay | 23.2–24.6 | 23.87/23.87 | 2 | ||||
| Left MDAII-IV | 30.3 | 1 | |||||
| Right MDAII-IV | 40.8–44.6 | 42.71/42.71 | 2 | ||||
| Bellatoripes (Western Canada) | 1 | Footprint Length | 620 | 1 | |||
| IDAII-III | 23 | 1 | |||||
| IDAIII-IV | 46 | 1 | |||||
| IDAII-IV | 70 | 1 | |||||
| Tyrannosauripus (Western U.S.) | 1 | Footprint Length | 740 | 1 | |||
| IDAII-III | 12 | 1 | |||||
| IDAIII-IV | 25 | 1 | |||||
| IDAII-IV | 37 | 1 | |||||
| Lesothosaurus | Left MT II Splay | 4.1 | 1 | ||||
| Left MT IV Splay | 7.3 | 1 | |||||
| Left MDAII-IV | 11.4 | 1 | |||||
| Heterodontosaurus | Right MT II Splay | 2.2–10.5 | 4.54/5.75 | 3 | |||
| Right MT IV Splay | 87–20.0 | 19.31/16.00 | 3 | ||||
| Right MDAII-IV | 10.9–30.5 | 23.86/21.75 | 3 | ||||
| Anomoepus (eastern North America) | 1 | Footprint Length | 29.5–105 | 98.5/86.4 | 26.8 | 7 | |
| IDAII-III | 12–30 | 22.9/21.3 | 6.0 | 8 | |||
| IDAIII-IV | 23–40 | 30.7/31.0 | 5.1 | 8 | |||
| IDAII-IV | 38–65 | 50.9/51.8 | 8.1 | 8 | |||
| Theropods (worldwide; lengths in cm) | 3 | Footprint Length | Footprint Length | 1.1–25.0 | 15.2/15.0 | 6.1 | 2456 |
| IDAII-IV | 10–47 | 55.0/57.3 | 19.4 | 1745 | |||
| Footprint Length > 25.0 cm | Footprint Length | 25.1–85.0 | 35.0/37.0 | 9.5 | 1899 | ||
| IDAII-IV | 15–121 | 54.0/55.3 | 16.3 | 1265 | |||
| Ornithischians (worldwide; lengths in cm) | 3 | Footprint Length | Footprint Length | 2.4–25.0 | 12.0/13.0 | 5.5 | 260 |
| IDAII-IV | 36–127 | 79.0/79.5 | 18.5 | 194 | |||
| Footprint Length > 25.0 cm | Footprint Length | 25.3–60.0 | 29.7/32.7 | 7.5 | 34 | ||
| IDAii iv | 37–96 | 65.5/67.7 | 16.6 | 26 |
More specific comparisons of large theropod foot skeletons and footprints can be made. Dilophosaurus, or a similarly large theropod, is widely regarded as a candidate for the maker of Eubrontes (cf. Farlow et al. 2018, 2025, and references therein). Although our metatarsal divarication data for Dilophosaurus are scant, they are consistent with the IDA values seen in Eubrontes.
Allosauroids are plausible trackmakers for many Late Jurassic and Early Cretaceous theropod footprints (Irenesauripus; Lower Cretaceous footprints of Texas and Arkansas [cf. Farlow, 2001]; possibly Megalosauripus). Allosauroids have subequal metatarsal II and IV divarications, and MDAII-IV values about 30°–40° (Tabs. 11, 12). The same is true of average IDAs of the Texas prints. Megalosauripus and Irenesauripus have comparable average IDAII-IV values to those of allosauroids and the Texas prints, but unlike them have larger IDAs III-IV than II-III (Tab. 12).
Tyrannosauroids have subequal metatarsal II and IV divarications, and average MDAII-IV values of about 30°–40° (Tabs. 11, 12). Our measurements of the probable tyrannosaurid footprint Tyrannosauripus have a substantially larger IDA III-IV than II-III, but an IDAII-IV of 37° (Tab. 12). A probable albertosaurine tyrannosaurid print, Bellatoripes, likewise has a larger IDA III-IV than II-III. The relative sizes of these IDAs do not seem consistent with the subequal MDAs presently available for tyrannosauroids (Tab. 12). Interdigital angle II-IV of Bellatoripes is a remarkable 70° (Tab. 12). In a sample of large footprints (length ranging 40.5–62 cm, mean 51.3 cm) attributed to albertosaurine tyrannosaurids from the Late Cretaceous Wapiti Formation of Alberta (including the present authors’ own measurements of Bellatoripes), IDAII-IV ranged 60°–92°, mean 76.7° (Enriquez et al., 2021: Tab. S1 “best outline” footprints). Tyrannosauroids apparently show substantially larger IDAII-IV values than one would expect from corresponding MDA values.
As with our measurements of Tyrannosauripus and Bellatoripes, our measurements of footprints identified as Kayentapus and Irenesauripus seem to have larger IDAs III-IV than II-III, while the two interdigital angles are nearly subequal in Grallator, Anchisauripus, Eubrontes (and also large prints from the East Berlin Formation of Connecticut), Megalosauripus, and footprints from the Lower Cretaceous of Texas and Arkansas (Tab. 12). Whether these differences can be correlated with metatarsal divarications of potential trackmakers in their respective ichnofaunas is for now an open question.
In contrast to Thulborn’s (1990) observations about ornithomimid footprint IDAs III-IV vs. II-III, the metatarsal divarication of digit IV is subequal to that of digit II in our sample (Tab. 12). In further contrast with the footprint sample, all three MDA values average substantially less than the IDAs reported by Thulborn. Farlow’s own IDA measurements (Dataset 1) of a right footprint from the classic ornithomimid trackway Ornithomimipus (CMNFV 8513: IDAII-III = 28°; IDAIII-IV = 38°; IDAII-IV = 67°) are close to Thulborn’s summary values. For the same trackway, Lockley et al. (2011) reported a slightly larger IDAII-IV (78°), but using Farlow’s measurement protocols, the IDAs for a tracing of a left footprint from this trackway (Lockley et al., 2011: fig. 10A) are 27° (II-III), 41° (III-IV), and 68° (II-IV).
As already noted, datasets 1 and 2 include Farlow’s IDA measurements for the Early Jurassic footprints Grallator and Anchisauripus, which have particularly narrow interdigital angles, with IDAII-IV values averaging 20°–30° (Tab. 12). These values are close to the MDAII-IV values of Coelophysis (although the sample size of the latter is small).
Metatarsal divarication angles of ornithopods (but not basal ornithischians) tend to be larger than those of small to mediumsized theropods in our sample (Tabs. 9, 10; Fig. 10). This is consistent with the generally larger IDAs of footprints attributed to small ornithischians (probably mainly ornithopods) than those attributed to similarly sized theropods—but recall that footprints attributed to small to medium-sized ornithischians have interdigital angles that fall completely within the spread of those for theropods (Fig. 14). Anomoepus is a common early Mesozoic footprint attributed to basal ornithischians or basal ornithopods (Olsen & Rainforth, 2003). Its IDA values are substantially larger than the MDA values of the basal ornithischian Lesothosaurus and the basal ornithopod Heterodontosaurus (Tab. 12).
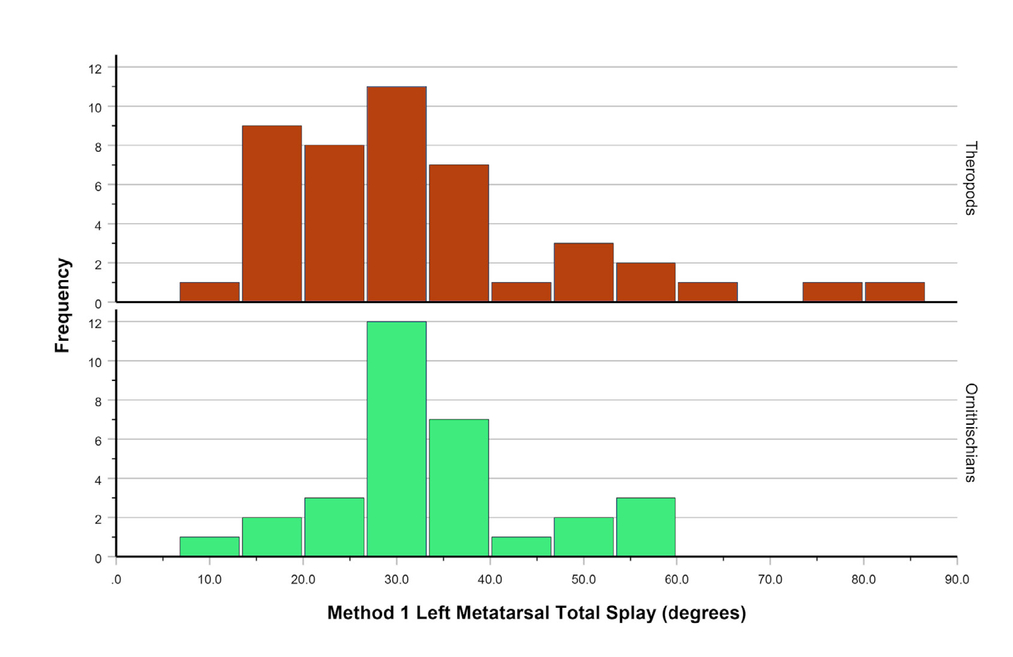
As a general observation, IDAII-IV values of tridactyl dinosaur footprints have greater average values than the corresponding total MDA values (Tab. 13; figs. 15–17). The range of IDAII-IV values is also greater than the range of MDAII-IV values (although, conceivably, that is a matter of very different sample sizes), but overall variability (as expressed by the coefficient of variation ([standard deviation / mean] * 100) is not greatly different for the MDA and IDA values (Tab. 13).
- MDA-1II-IV of all the dinosaur feet in our sample. Theropods at top, ornithischians at bottom.
| Group | Size Class | Parameter | Dataset | Range | Median/Mean | Standard Deviation n (Coefficient of Variation) | n |
|---|---|---|---|---|---|---|---|
| Theropods | MT III Length ≤ 25 cm | Left MDAII-IV | 19.6–81.3 | 28.6/34.2 | 18.0 (52.6) | 10 | |
| MT III Length > 25 cm | Left MDAII-IV | 13.9–77.2 | 32.0/35.6 | 15.4 (43.1) | 25 | ||
| Print Length ≤ 250 mm | IDAII-IV | 2 | 13–116 | 38.0/41.3 | 18.3 (44.3) | 131 | |
| Print Length > 250 mm | IDAII-IV | 2 | 15–85 | 46.0/46.4 | 13.4 (28.9) | 223 | |
| Print Length 0–20.00 cm | IDAII-IV | 3 | 10–147 | 55.0/58.0 | 20.1 (34.7) | 1336 | |
| Print Length 20.01–40.00 cm | IDAII-IV | 3 | 17–121 | 55.0/56.0 | 16.4 (29.3) | 1359 | |
| Print Length > 40.01 cm | IDAII-IV | 3 | 15–97 | 51.0/51.8 | 15.4 (29.8) | 315 | |
| Ornithischians | MT III Length ≤ 25 cm | Left MDAII-IV | 11.4–57.3 | 31.8/32.6 | 10.4 (32.1) | 30 | |
| MT III Length > 25 cm | Left MDAII-IV | 13.9–55.5 | 28.4/28.7 | 11.3 (38.1) | 11 | ||
| Print Length ≤ 250 mm | IDAII-IV | 2 | 46–102 | 58.0/61.7 | 15.6 (25.2) | 11 | |
| Print Length 0–20.00 cm | IDAII-IV | 3 | 36–127 | 81.0/82.1 | 18.2 (22.2) | 167 | |
| Print Length 20.01–40.00 cm | IDAII-IV | 3 | 37–96 | 64.0/65.7 | 13.4 (20.5) | 51 | |
| Print Length > 40.01 | IDAII-IV | 3 | 39–85 | 62.0/62.0 | ----- | 2 |
DISCUSSION
Evaluation of MDA
Of the many possible ways of quantifying distal metatarsal divarication—and, by extension, presumed toe splay—is any particular method better than the rest? We tested only two methods here, although other methods were considered and rejected by Davidson (2024). Of these, MDA-1 has several shared and unique advantages. First, the method has a higher repeatability (lower intraobserver error) than those investigated by Davidson (2024). Second, it has a low systematic error with respect to body size and tightness of metatarsal articulation (Tab. 2). Third, because measurements of MDA-1 are intrinsic to metatarsals II and III, they require neither complete nor articulated metatarsi. This has the potential to facilitate increased sample size. Fourth, it can detect more significant between-group differences (Tab. 7). Lastly, and perhaps most importantly, the method most closely approximates interdigital angles from trackways, although MDA-1 underestimates IDA by several degrees, on average (Fig. 5). To be sure, MDA approximates IDA, but the two are not equivalent.
The choice of method matters most when comparing groups having large MDAs, where estimates may vary widely between MDA-1 and -2 (Fig. 4). We do not purport to know the reason for this heteroscedastic relationship, but some possible explanations might be offered. First, it may simply be an upshot of the magnitude of the angles: measurements of small values, being small and closer to the lower bound of zero, are less apt to vary compared to measurements of larger values. Second, and perhaps more likely, we note that metatarsals having a large distal bend also tend to be bent proximally (e.g., Fig. 3a, g), which is likely to lead to larger measurements of MDA-1 relative to -2 (which does not consider the proximal metatarsus). This property of MDA-1 may bring toe splay estimates more closely in line with IDA (Fig. 5), at least for animals having more widely splayed toes.
Ontogenetic allometry
Using a large dataset of extant emu trackways collected across multiple individuals over several years, Farlow et al. (2018) demonstrated negative allometry of IDAII-IV; as individuals grow larger, the outward splay of their toes as the foot contacts the substrate is reduced. To be sure, there is great variance about the trendline (Farlow et al., 2018: fig. 6.20), but the trend is nevertheless striking.
Interestingly, our MDA data do not scale in the same way. The relationship of metatarsal divarication with tarsometatarsus length is either positively allometric (using MDA-2) or else nonexistent (using MDA-1). Possibly, this is an issue of sample size, as our sampling of immature emu (tarsometatarsus length < 30 cm) is underdeveloped. Pessimistically, perhaps MDA is not a good proxy for toe splay after all. We note that two immature emu in our sample suffered from splayed-leg disorder, for which gait may be altered. Although we took steps to minimize potential issues, it may have affected our findings in ways we do not yet understand.
Does toe splay also decrease with growth in non-avian dinosaurs? Our MDA measurements for both albertosaurines and Allosaurus— if taken at face value—suggest perhaps not. Rather, there is no apparent relationship between age and MDA at all (Tab. 5; Fig. 7). Trackways attributed to very young tyrannosaurids (mean footprint length of trackways ranging 5.08–6.77 cm, mean 5.89 cm) from the Upper Cretaceous St. Mary River Formation of Alberta have IDAII-IV ranging 40.4°–63.4°, mean 52.3° (Henderson et al., 2022: Tab. 1)— much smaller values than those of the larger probable tyrannosaurid prints from the Wapiti Formation described by Enriquez et al. (2021). If the diminutive St. Mary River Formation dinosaur tracks have been correctly identified (and granting that, even if so, their makers were not necessarily conspecific or even congeneric with the Wapiti Formation trackmakers), IDAII-IV seems to have increased with ontogeny in tyrannosaurids—contrary to our expectations based on MDAII-IV (and opposite the trend seen in emus).
Phylogenetic allometry
Our study of the relationship between MDA and body size provides a possible explanation for the disagreement concerning the presence of phylogenetic allometry in the IDA of dinosaur footprints (e.g., Olsen, 1995; Farlow et al., 2018 vs. Lallensack et al., 2019). That is, there appears to be a phylogenetic component to the relationship between toe splay (approximated by MDA) and body size. Whereas we recover a generally positive relationship between size and MDA across Dinosauria, Theropoda, Ornithischia, and Ornithopoda (Fig. 8), this trend breaks down with finer taxonomic resolution. Undoubtedly, in some cases the breakdown reflects low sample size, something which only further sampling (and a better fossil record) can alleviate. However, in other cases, particular subclades (e.g., Allosauroidea, Ceratosauria) appear to exhibit a predicted toe splay that scales in a manner completely opposite to that of the more inclusive parent clade (Fig. 8). Differential phylogenetic sampling of the ichnological record (which can manifest via different geographic or temporal sampling) can therefore be expected to sometimes yield very different trends in IDA.
The positive phylogenetic allometry in MDA seen in, e.g., Theropoda and Ornithischia requires explanation. Perhaps, at larger body sizes, bipedal dinosaurs needed to distribute their massive weight over a larger surface area for stability and so spread their toes further apart. Why certain groups (Allosauroidea, Ceratosauria) do not follow the same trend is unclear, although these groups are represented by small sample sizes, which may not accurately reflect the true signal, despite statistical significance.
Metatarsal splay, interdigital angles, and distinguishing among trackmaker groups
The greater average values, and the greater range of values, of the IDAs compared to MDAs make sense. As the foot touches the ground, the force of impact could be expected often to spread the toes further apart than in their “neutral” articular positions, and the vagaries of the foot-sediment interaction during touchdown could cause the toes to spread apart in a variety of configurations. This might be expected to occur to a greater extent in the thinner, presumably more flexible toes of smaller theropods and ornithischians than in large theropods, and thus account for the greater range and variability of IDAII-IV values in smaller than larger dinosaurs (Tab. 13; figs. 14–16). Greater digital flexibility of the toes of small individuals could also explain the surprising discrepancy already noted of the ontogenetic relationship between tarsometatarsus length and MDAII-IV, as compared with footprint size and IDAII-IV, of emus.
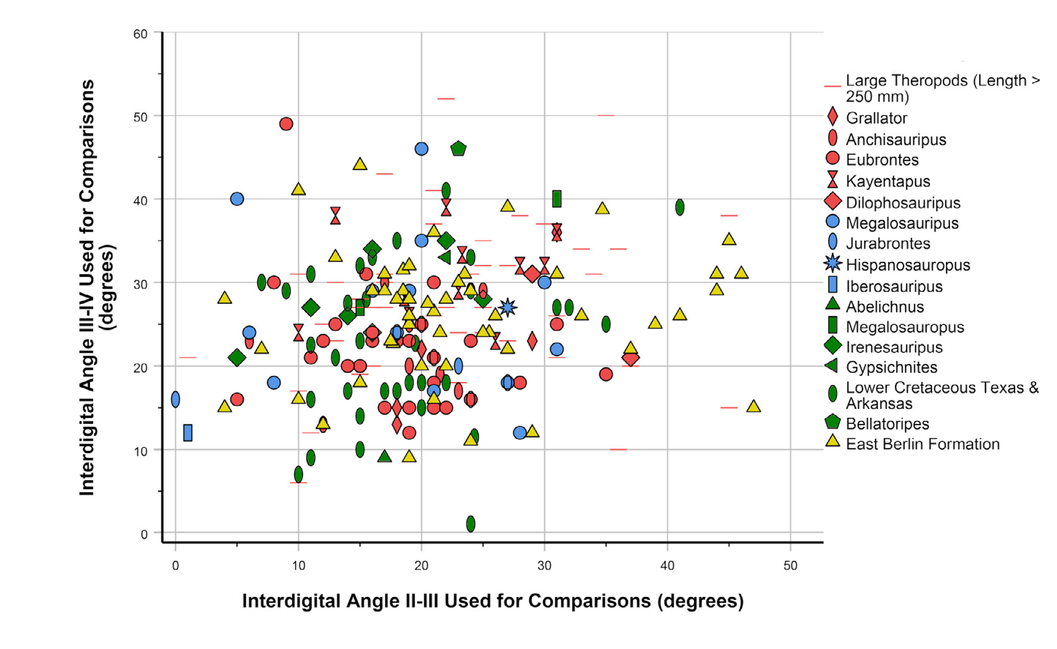
The lack of consistent correlation between MDAs and IDAs suggests that the former probably cannot (presently?) be relied on to establish expectations for discriminating among different clades of bipedal dinosaur trackmakers. Metatarsal divarications are generally uniform across different clades of large theropods of comparable size, for example (Tab. 12; Fig. 10), but some large theropod footprint morphotypes seem to differ in whether IDAIII-IV is subequal to, or larger than, IDAII-III (Tab. 12; Fig. 18). Ascertaining whether these differences can be correlated with differences in metatarsal divarications (the tyrannosauroid data are presently discouraging), or whether other explanations must be considered, depends on hoped-for future discovery of well-preserved foot skeletons in the same formations for comparisons between bones and tracks. At the other size extreme, the greater (extramorphological?) variability of IDAs in footprints of small to mid-sized bipedal dinosaur footprints may be enough to swamp those phylogenetic signals that are preserved in MDAs (Tabs. 9, 10; Fig. 10).
- Interdigital angles III-IV vs. II-III of large theropods (footprint length ≥ 250 mm; Dataset 2). Selected ichnotaxa and footprints from selected faunas are indicated in the legend. Footprints from the East Berlin Formation are probably mostly Eubrontes (Farlow et al., 2025). “Large theropods” in the legend are miscellaneous other large-theropod ichnotaxa.
Application to a Late Jurassic dinosaur assemblage
In an assessment of the Late Jurassic dinosaur assemblage at Como Bluff, Wyoming, Bakker (1996) classified the animals according to foot size, reasoning that animals with longer, more widely splayed toes would be better suited to occupying swampy habitats than those with more compact feet. This study provided no objective means by which to verify his classification, but the ornithischians were categorised as follows, from most compact to broadest footed (relative to body size): (1) stegosaurs, (2) Dryosaurus, (3) Camptosaurus, and (4) the small ornithopods ‘Drinker’ and ‘Othnielia’ (both commonly recognised as Nanosaurus agilis, but see Barrett & Maidment, 2025). The sauropods and theropods were classified separately, the latter including the narrow-footed Allosaurus and the broad-footed Ceratosaurus and Torvosaurus (= ‘Edmarka’ and Brontoraptor’ of his usage). Bakker (1996) argued for habitat partitioning, noting that these taxa tend to occur in the sediment types one would expect given the foot morphology of the animal (e.g., compact-footed stegosaurs and Dryosaurus in well-drained environments; broad-footed ‘Drinker’ and Apatosaurus in poorly drained environments).
While these taxa are not all represented in our dataset, many of them are, and these afford an opportunity by which to test Bakker’s (1996) classification. Among the ornithischians, and with reference to MDA-1II-IV, Nanosaurus scores 34°, Dysalotosaurus (a close relative of Dryosaurus) ranges 32°–49°, and Camptosaurus ranges 20°–56°. The theropods Allosaurus ranges 10°–58° and Ceratosaurus scores 20°. Thus, we find no support for Bakker’s (1996) model, citing no clear separation of these taxa as regards the presumed splay of their toes (but see earlier stated caveats). These considerations aside, we question whether such large animals would have exhibited such strict habitat specificity in the first place.
CONCLUSIONS
We set out to determine whether the bony morphology of (primarily) tridactyl dinosaur feet can be used to predict allometric trends and taxonomic differences in the interdigital angles of their tracks. Metatarsal divarication angle may have some predictive utility in the sense that some of the patterns that it exhibits are also reflected in the IDA of dinosaur tracks (e.g., in the positive phylogenetic allometry of toe splay in theropods and ornithischians and the subtly narrower toe splays of the former). There are, however, many points of disagreement between MDA and IDA, which serves as an important reminder that the two measurements do not capture precisely the same information. Rather, MDA consistently underestimates IDA, indicating that additional factors, whether morphological and/or extramorphological, must contribute to the spread of the toes.
Nevertheless, the group differences in metatarsus structure that we document here, however subtle, lead us to be cautiously optimistic that that IDAs of tridactyl footprints are useful parameters to measure. Together with other footprint measurements (e.g., relative lengths and widths of digit and toe pad impressions, relative lengths of distal compared with more proximal portions of footprints) and trackway measurements, IDAs may help with making provisional recognition of footprint morphotypes. This might better be accomplished by comparing footprint morphotypes within an ichnofauna, as opposed to making broad-scale comparisons of footprints across different ichnofaunas. With a sufficiently large sample of both footprints and foot skeletons, it may be possible to determine whether, or how closely, different footprint morphotypes can be associated with skeletal taxa.
ELECTRONIC SUPPLEMENTARY MATERIALS
This article contains electronic supplementary material which is available at https://doi.org/10.3301/IJG.2025.16.